O3 - Normal mean hypothesis tests
Test a population mean using a Normal model with known, given or assumed population variance. Find the distribution of a sample mean, use the correct tail or critical values, and interpret a complete test without confusing the sample result with the population claim.
The distribution of a sample mean
Individual packet masses have standard deviation . How can a mean of just packets have standard deviation only , and why would halving that uncertainty again require packets?
An individual packet can be unusually heavy or light. In an average, some positive and negative departures offset one another. The mean varies between samples, but less than individual observations vary within the population.
You already know
For , the second parameter is the variance, and is the standard deviation. The observed mean of values is . Standardising a Normal variable means subtracting its mean and dividing by its standard deviation.
Use for the random sample mean before observing the sample, and for the realised mean. They are different: one has a probability distribution; the other is the number calculated from the observations.
Sampling distribution of a Normal mean
For an independent random sample of size from ,
In the formula booklet.
The supplied standardisation tells us that , with standard deviation . This equivalent distribution is recovered from the booklet result; it is not a separate printed formula. Its variance is , not its standard deviation.
To see the scaling, independent observations give a sum with variance . Dividing that sum by divides its variance by , leaving . These variance-scaling facts explain the supplied formula; they are not printed separately in the booklet. Four times the sample size divides the variance by four and the standard deviation by two. Because the population is Normal, the mean's Normal distribution is exact even for a small sample under the independence assumption.
Worked example 1: sixteen packets
Question. Individual packet masses follow , in grams. For an independent random sample of , find the distribution of the mean and .
Plan. Divide the population variance by the sample size, then calculate the interval probability using the mean's standard deviation.
Why use , rather than ? The event concerns an average of sixteen packets, rather than one packet.
Answer. , and the probability is to significant figures.
Check. The interval is symmetric about , so its two excluded tails have equal probability.
Example 2 changes only the sample size, from to . The same mass interval now contains a larger proportion of sample means.
Worked example 2: sixty-four packets
Question. For the same population, use an independent random sample of . Find the distribution of its mean and .
Plan. Recalculate the sampling spread and standardise the unchanged endpoints.
Why are the standardised endpoints further apart? The fixed mass interval covers more units of the smaller sample-mean standard deviation.
Answer. , and the probability is to significant figures.
Check. Quadrupling halved the standard deviation, from to , answering the opening question.
Use the known, given or assumed population variance in this method. A sample variance estimates population spread; it does not make that spread known. A test with unknown population variance requires another method, outside this lesson.
Watch out
Wrong: for , the mean's standard deviation is . Standard deviations scale with , rather than . Right: . It is the variance that is divided by .
When a calculator asks for standard deviation, enter , not the variance .
Population hypotheses and standardisation
The null specifies the population mean used to calculate the reference distribution. The observed sample mean then tells us how far the evidence departs from that claim.
Define in the context. For reference value , use . A decrease uses , an increase uses , and a change uses . These hypothesis conventions are not in the formula booklet: learn them. Choose the direction before observing the sample.
Under , replace by in the booklet's sampling-distribution formula. Its observed standardised value is
This is the supplied standardisation evaluated at the observed mean. It counts how many sample-mean standard deviations the result lies above or below the null mean. It is not a difference measured in individual-observation standard deviations.
Write for the standard Normal cumulative probability. A lower-tail alternative uses p-value ; an upper-tail alternative uses . These tail choices are not printed in the formula booklet: learn them. A negative does not support an increase: its upper-tail p-value exceeds .
Worked example 3: reduced battery life
Question. Independent battery lives are Normal with population standard deviation hours. A random sample of has mean hours. Test at whether population mean life has fallen below hours.
Plan. Use a lower-tail probability for the sample mean under the claimed population mean.
Let be the population mean battery life.
Why use the lower tail? Smaller sample means support a reduction in population mean life.
Answer. Reject . There is sufficient evidence at to suggest that the population mean battery life is below hours.
Check. The statistic is negative because the sample mean lies below the null mean. Equivalently, , the lower critical value.
Example 4 changes only the observed sample mean. Keep the population variance and sampling model unchanged.
Worked example 4: a smaller departure
Question. Carry out the same lower-tail test when the mean of the battery lives is hours.
Plan. Update the standardised departure and recalculate its lower-tail probability.
Why does the decision change? The new observation is less extreme in the tested direction and has a larger null probability.
Answer. Do not reject . There is insufficient evidence at to suggest that the population mean battery life is below hours.
Check. The sample mean remains below , but an observed difference alone does not establish a significant population reduction.
AQA expects the population mean and its tested direction in the conclusion. “The batteries have changed” does not identify the quantity tested.
Watch out
Wrong: , followed by comparison with a negative lower critical value. Reversing the subtraction reverses the sign. Right: , or calculate the lower sample-mean probability directly.
The next question isolates hypothesis choice so that the required tail is clear before calculation begins.
Critical values and two-tailed tests
A critical region gives a decision boundary before the sample is observed. For a continuous Normal distribution, you can allocate the significance probability exactly, assuming the model holds.
Use inverse Normal on your calculator. An upper tail leaves cumulative probability below its boundary, giving . A lower tail uses . For a two-tailed test, allocate to each tail:
These critical values are not printed in the formula booklet; obtain them using inverse Normal rather than memorising rounded boundaries. The booklet supplies the sampling standardisation used to convert them into sample means.
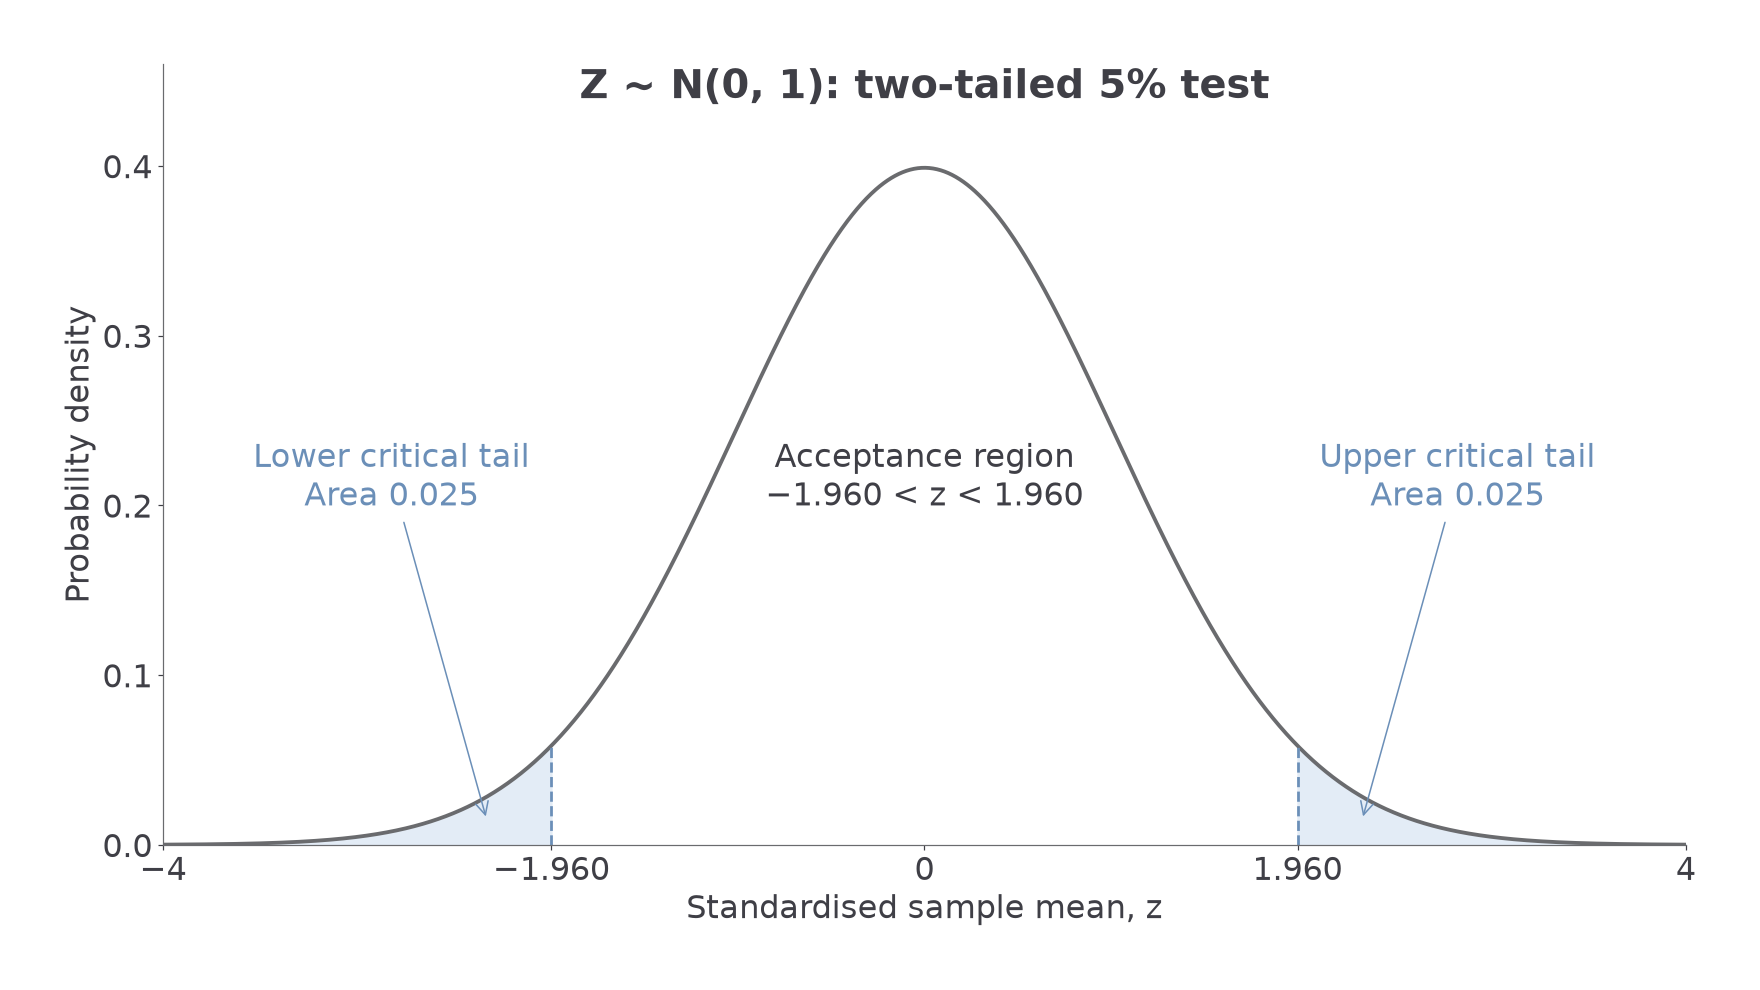
Reject when lies in either shaded tail. For a continuous variable, strict or inclusive boundary inequalities give the same probability because a single exact value has probability zero.
Two-tailed Normal p-value
For an observed standardised statistic in a test against a change in either direction,
Normal symmetry makes this twice the smaller tail probability. Not in the formula booklet: learn it.
Continue this lesson.
You’re previewing NovaLearn without an account. Create a free account to read the rest.
Create free account