RP11 - Glucose calibration curve
A Benedict's colour only hints at how much glucose a sample holds. Make a dilution series, build a colorimetric calibration curve and use it to estimate the glucose in an unknown ‘urine’ sample, then judge how far to trust the answer.
What colorimetry measures
A colorimeter turns a colour change into a number, so you can put a figure on glucose instead of judging by eye.
Glucose is a reducing sugar. Heated with Benedict's reagent, it reduces blue copper(II) ions to copper(I), so more glucose leaves less blue and forms more precipitate.
As in RP04, a colorimeter passes light of a selected wavelength through a sample and measures how much reaches a detector. Higher absorbance means less light got through. Absorbance is dimensionless, so it has no unit.
The instrument measures light, not glucose. To link the two, you read solutions of known concentration, each called a standard.
Calibration curve
A calibration curve is a graph that relates a measured signal to known concentrations, so that the concentration of an unknown sample can be estimated.
Two reagents, two different signals
AQA's set-up guide allows either reagent below. The names mislead: both are used for measurement here.
| Qualitative Benedict's | Quantitative Benedict's | |
|---|---|---|
| Precipitate | Coloured copper(I) oxide | White |
| Wavelength | 600 nm (orange/red filter) | 680 nm (red filter) |
| Handling | Shake, then read promptly, before the copper(I) oxide settles | Let the precipitate settle, then carefully pipette the clear liquid (supernatant) into the cuvette |
| Absorbance shows | Colour plus light scattering by suspended particles | The blue left behind, so it usually falls as glucose rises |
Suspended particles scatter light away from the detector, which adds to the absorbance reading. Once a white precipitate has settled, the remaining blue is the only colour left to measure.
So a calibration graph need not rise or be straight, and the routes must not be mixed: a curve from suspensions is no use for clear liquid. This lesson's figures follow the qualitative route.
Blanks and negative controls
A blank sets the optical reference: the colorimeter reads 0 for it, so every later reading is relative to it.
The zero-glucose standard (the “zero-glucose blank” of 3.1.2) is a negative control: taken through the whole method, it shows the background response without glucose. The qualitative route here also zeroes on this heated mixture. A remaining-blue route may zero on water and measure that standard like any other, so zero glucose need not mean zero absorbance.
Preparing standards and known dilutions
Every concentration you read later rests on these volumes, so accurate standards come first.
A dilution series contains several known concentrations prepared from a stock. Mixing each standard independently from stock and water, as in RP03, stops pipetting errors accumulating from tube to tube.
If no glucose is added or lost during mixing, the amount is conserved:
Dilution equation
is stock concentration, is stock volume taken, is desired concentration and is final volume before reagent addition. Use the same units on both sides.
Water volume is , not . For 2.00 cm³ of a 6.0 mmol dm⁻³ standard, cm³ of stock, leaving 0.80 cm³ of water:
| Glucose / mmol dm⁻³ | Stock at 10.0 mmol dm⁻³ / cm³ | Distilled water / cm³ |
|---|---|---|
| 0.0 | 0.00 | 2.00 |
| 2.0 | 0.40 | 1.60 |
| 4.0 | 0.80 | 1.20 |
| 6.0 | 1.20 | 0.80 |
| 8.0 | 1.60 | 0.40 |
| 10.0 | 2.00 | 0.00 |
Use a calibrated pipette and a filler, never your mouth, and read a glass pipette's meniscus at eye level. Change tips or rinse to prevent contamination. Mix fully and label each tube before adding reagent.
Serial dilution
A serial dilution makes each solution from the one before: 1.00 cm³ of 10.0 mmol dm⁻³ stock plus 9.00 cm³ of water gives 1.0 mmol dm⁻³, and repeating from that gives 0.10 mmol dm⁻³. An early error carries into every later tube.
Exam tip
When describing a dilution, give the volumes. In a 2024 question, “dilute with water” missed the mark, while one part stock to nine parts water, repeated, earned it.
Correcting for a diluted unknown
A dilution factor is final volume divided by volume of original sample: 1.00 cm³ of unknown plus 4.00 cm³ of water gives 5.00/1.00 = 5, not 4. If that mixture measures 3.2 mmol dm⁻³, the original was 5 × 3.2 = 16 mmol dm⁻³. Multiplying restores the concentration; dividing would dilute it again.
Reagent addition dilutes every tube too. The x-axis uses concentrations before reagent addition and unknowns are treated identically, so apply no extra factor for reagent volume.
A controlled colorimetric method
A curve only fits an unknown treated exactly like the standards, so each step here removes a difference between tubes.
The independent variable is the glucose concentration of the standards; the dependent variable is absorbance at the chosen wavelength.
The figure shows one school protocol for the qualitative route. Its volumes, temperature and time are controlled choices, not universal values.
[DIAGRAM: asset_name: RP 11 - Production of a dilution series of a glucose solution and use of colorimetric techniques to produce a calibration curve with which to identify the concentration of glucose in an unknown 'urine' sample - Diagram 1; asset_slug: RP 11 - Production of a dilution series of a glucose solution and use of colorimetric techniques to produce a calibration curve with which to identify the concentration of glucose in an unknown 'urine' sample - Diagram 1; recommended_method: retained_png; caption: One qualitative Benedict’s protocol uses equal sample treatment, a controlled heating stage, cooling and measurement at 600 nm.; description: One qualitative Benedict’s protocol uses equal sample treatment, a controlled heating stage, cooling and measurement at 600 nm.]
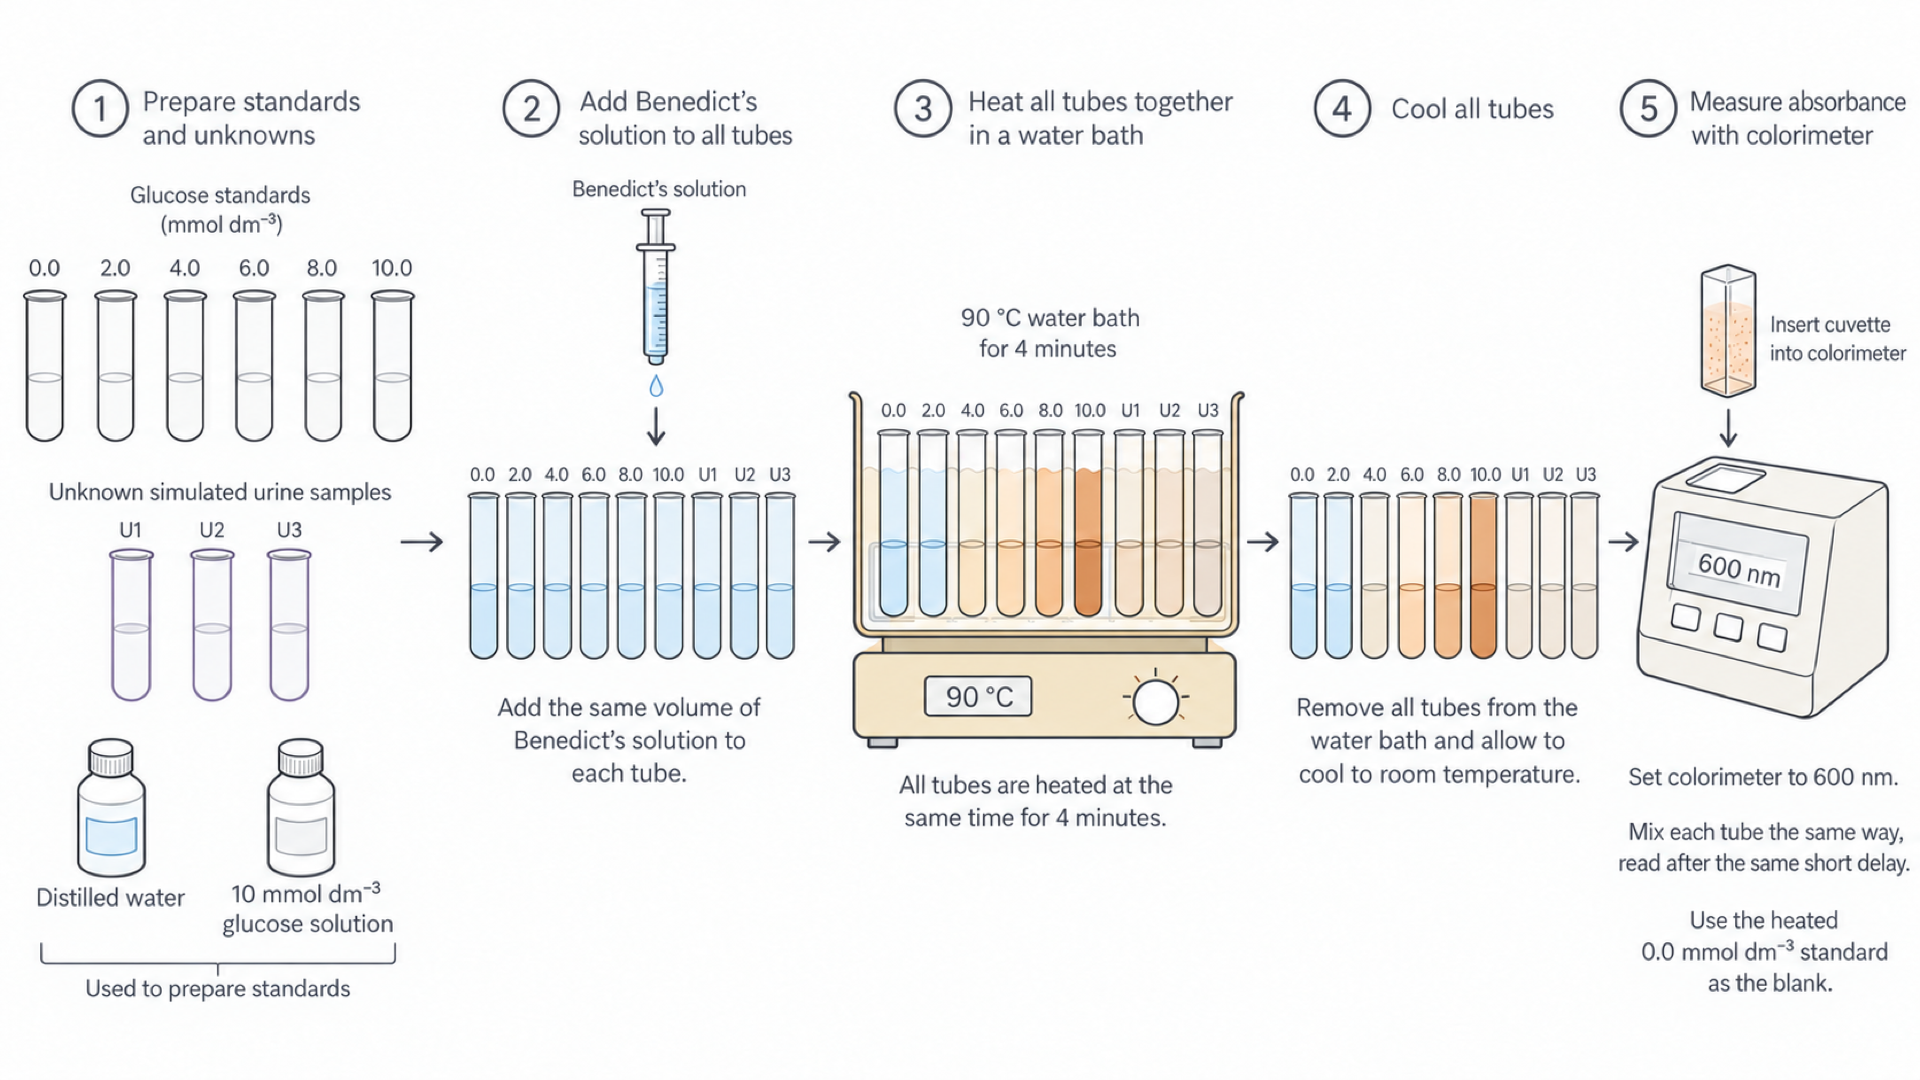
The cuvette in panel 5 holds a mixed suspension; settled clear liquid belongs to the quantitative route at 680 nm.
Method, with the reason for each step
- Put equal volumes of each standard and simulated unknown, such as 2.00 cm³, into labelled tubes, because volume sets the amount of glucose present.
- Add the same volume of Benedict's reagent to each, such as 2.00 cm³, and mix. The reagent must be in excess: if copper(II) ions ran out, extra glucose could not change the signal and the curve would flatten.
- Heat all tubes together in a water bath, such as 90 °C for 4 minutes, because temperature and time affect how far the reaction goes.
- Cool all tubes to room temperature, so they stay comparable and are safe to handle.
- Set the colorimeter to 600 nm and zero it with the specified reference, so readings share one baseline.
- Shake each tube the same way, fill a cuvette and read after the same short delay, because settling changes light scattering.
- Hold cuvettes by their ridged or opaque sides, wipe the clear faces, fill above the beam, remove bubbles and keep the same orientation, because fingerprints and bubbles reduce light transmission regardless of glucose.
- Record all readings, concentrations and settings.
Exam tip
Name control variables precisely. In a 2025 calibration question, sample volume, temperature and filter or wavelength earned the mark, while “same colorimeter” fell short.
Repeats and safety
Prepare independent replicate tubes at each concentration, rather than rereading one cuvette, which captures variation in preparation and reaction as well as measurement. Repeat unknowns too, then calculate means and inspect their spread.
Wear eye protection and follow the reagent safety assessment. Use a controlled water bath, not a naked flame, and handle hot tubes with a holder or tongs, pointing openings away from people. Simulated urine avoids biological hazards.
Continue this lesson.
You’re previewing NovaLearn without an account. Create a free account to read the rest.
Create free account