3.3.4.1 - Mass transport in animals
Diffusion alone is too slow to supply a large animal, so mammals pump blood. This lesson follows oxygen from haemoglobin through the heart and vessels to the fluid around cells, then covers cardiac data, evidence on cardiovascular disease and pulse investigations.
Mass transport and oxygen carriage
Diffusion can supply a single cell but not a whole mammal, so blood carries oxygen to the tissues.
As an animal gets larger, its surface area to volume ratio falls and most cells lie far from any exchange surface. Diffusion is too slow over these distances to supply enough oxygen and nutrients.
Mass transport moves substances in bulk: a pressure difference drives blood along vessels. Mammals have a closed, double circulatory system carrying blood between the lungs, the heart and body tissues.
Red blood cells and haemoglobin
Red blood cells transport most of the oxygen in the blood.
| Adaptation of a red blood cell | Why it helps oxygen transport |
|---|---|
| Biconcave shape | Gives a large surface area to volume ratio for rapid diffusion of oxygen |
| Thin centre | Shortens the diffusion pathway for oxygen |
| No nucleus or mitochondria | Leaves more space for haemoglobin; no mitochondrial aerobic respiration consumes the carried oxygen |
| Flexible cell membrane | Allows cells to squeeze through narrow capillaries |
Inside the cell, oxygen binds to haemoglobin.
Haemoglobin
A globular protein with a quaternary structure. Each haemoglobin molecule has four polypeptide chains, and each chain contains a haem group with an ion that can bind one oxygen molecule.
When oxygen binds to haemoglobin, oxyhaemoglobin is formed. With four haem groups, each molecule can carry up to four oxygen molecules. The binding is reversible: oxygen loads in the lungs, where it is plentiful, and unloads in respiring tissues, where respiration uses it up.
Link each feature to its function: “biconcave” alone earns nothing, but “biconcave, giving a large surface area for diffusion” earns the mark.
Dissociation curves and the Bohr effect
One S-shaped graph explains how the same haemoglobin loads oxygen in the lungs and releases it in the tissues.
Affinity means how readily haemoglobin binds oxygen. Partial pressure of oxygen () measures the contribution oxygen makes to the pressure of a gas mixture; dissolved oxygen equilibrates with it.
Oxyhaemoglobin dissociation curve
A graph showing the relationship between partial pressure of oxygen and the percentage saturation of haemoglobin with oxygen.
Start with the rose curve in this diagram.
[DIAGRAM: asset_name: transport-bohr-curves; asset_slug: transport-bohr-curves; recommended_method: retained_png; caption: Illustrative oxyhaemoglobin curves at lower and higher carbon dioxide, with axes in kPa and percentage saturation.; description: Illustrative oxyhaemoglobin curves at lower and higher carbon dioxide, with axes in kPa and percentage saturation.]
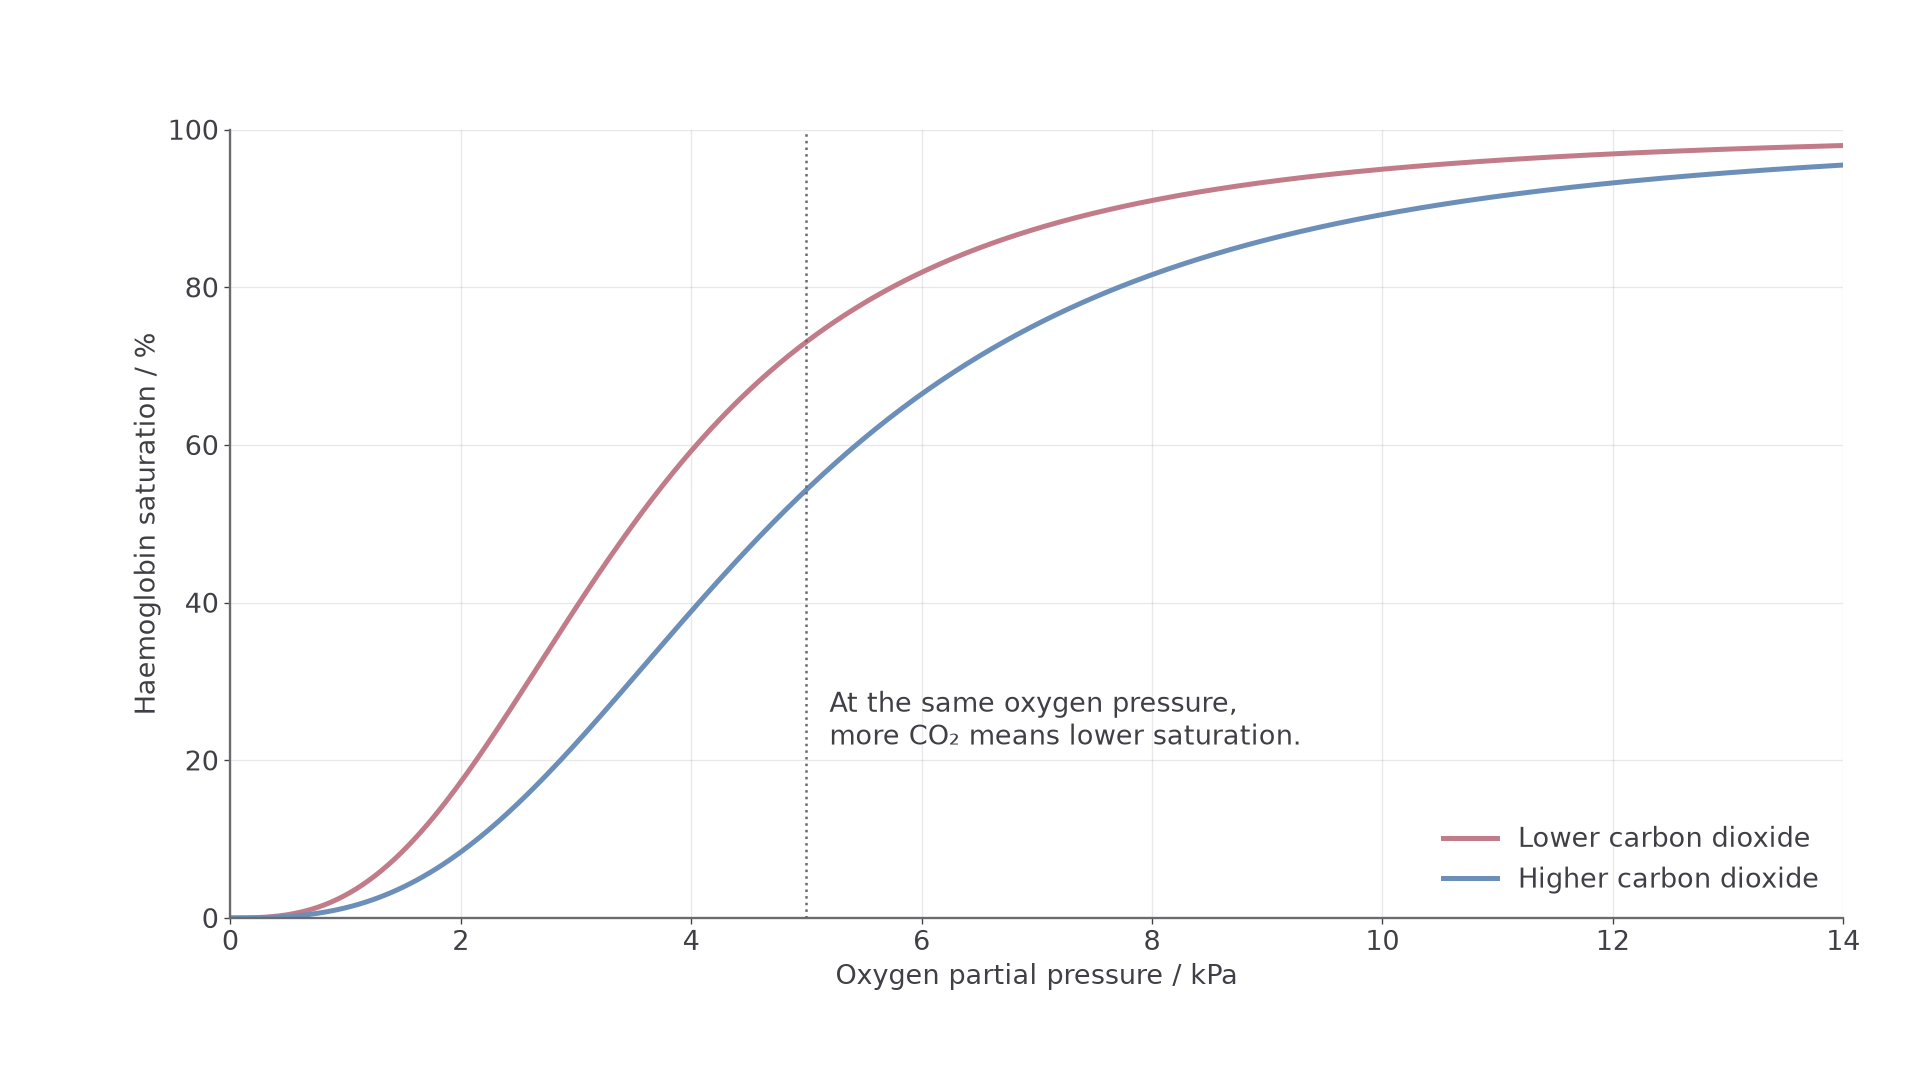
Illustrative curves, not measurements from a patient.
Why the curve is S-shaped
Oxygen binding is cooperative, which gives the curve its sigmoid, or S, shape.
- At low partial pressure of oxygen, the first oxygen molecule binds with relative difficulty, so the curve rises slowly at first.
- When it binds, haemoglobin changes shape slightly.
- This shape change makes it easier for further oxygen molecules to bind, so the curve rises steeply.
- At high partial pressure of oxygen, most binding sites are already occupied, so the curve levels off.
This shape suits each stage:
- Lungs: partial pressure of oxygen is high, so haemoglobin becomes highly saturated. The top of the curve is flat, so saturation stays high even if partial pressure falls a little.
- Transport: partial pressure stays high in arteries, so little oxygen unloads.
- Respiring tissues: partial pressure is lower. The middle of the curve is steep, so a small fall in partial pressure causes a large fall in saturation and a lot of oxygen unloads.
The Bohr effect
Carbon dioxide also affects saturation.
Bohr effect
An increase in carbon dioxide concentration lowers blood pH and reduces haemoglobin's affinity for oxygen, so the dissociation curve shifts to the right and more oxygen is unloaded.
Actively respiring cells produce more carbon dioxide, which forms an acid in blood, so pH falls. The lower pH changes haemoglobin's shape, so oxygen is released more readily. Carbon dioxide does not simply displace oxygen from its haem binding site.
In the lungs, carbon dioxide leaves the blood, so pH rises and affinity recovers.
Read up the dotted line at 5 kPa to compare both curves at the same partial pressure. Saturation is about 73% at lower carbon dioxide and 54% at higher.
Blood arriving at 97% has unloaded 24 percentage points of its capacity in the first case and 43 in the second: a gain of 19 points, not a 19% increase.
Key idea
A left-shifted dissociation curve means higher affinity for oxygen. A right-shifted curve means lower affinity for oxygen and easier unloading.
A full explanation covers three stages: the first oxygen, the shape change and the occupied sites.
Haemoglobins with different affinities
Bar-headed geese cross the Himalayas, and a difference in their haemoglobin helps explain how.
The haemoglobins are a group of chemically similar molecules found in many different organisms, but they are not identical. Differences in amino acid sequence change the protein's shape, and so its affinity for oxygen. Many animals are adapted to their environment in this way.
The geese fly through air with a low partial pressure of oxygen. Their haemoglobin has a higher affinity than that of the lowland greylag goose, which helps their lungs load oxygen.
- Animals living where oxygen is scarce often have higher-affinity haemoglobin. Their curve is shifted left, so they can load oxygen at low partial pressure.
- Small, very active mammals often have lower-affinity haemoglobin. Their curve is shifted right, so oxygen unloads readily to tissues with a high metabolic rate.
- Fetal haemoglobin has a higher affinity than adult haemoglobin, so the fetus can load oxygen from the mother's blood at the placenta.
Maternal and fetal blood stay in separate circulations, so oxygen diffuses across the placental barrier. Fetal haemoglobin takes up oxygen from solution, which helps maintain the diffusion gradient.
Reading two curves
Compare two haemoglobins at the same partial pressure: higher saturation means higher affinity.
Higher affinity has a disadvantage: it can make unloading harder. A left shift is not always better, so explain an adaptation using both the environmental oxygen supply and the tissue demand.
Exam tip
Locate the lungs or gills (high partial pressure) and the tissues (low) on the axis first. Curves can differ at one end and overlap at the other.
Double circulation and heart structure
Blood passes through the heart twice on each circuit, so body pressure can be high while lung pressure stays low.
Mammals have a closed, double circulatory system:
- In the pulmonary circulation, blood travels from the heart to the lungs and back.
- In the systemic circulation, blood travels from the heart to the body tissues and back.
Blood therefore passes through the heart twice in one complete circuit. Blood returning from the lungs can be pumped to the body at high pressure, while blood going to the lungs travels at a lower pressure.
Tracing the route
Start at the vena cava and follow the arrows.
[DIAGRAM: asset_name: transport-heart-structure; asset_slug: transport-heart-structure; recommended_method: retained_png; caption: Schematic connections of the four heart chambers, major vessels and one-way valves.; description: Schematic connections of the four heart chambers, major vessels and one-way valves.]
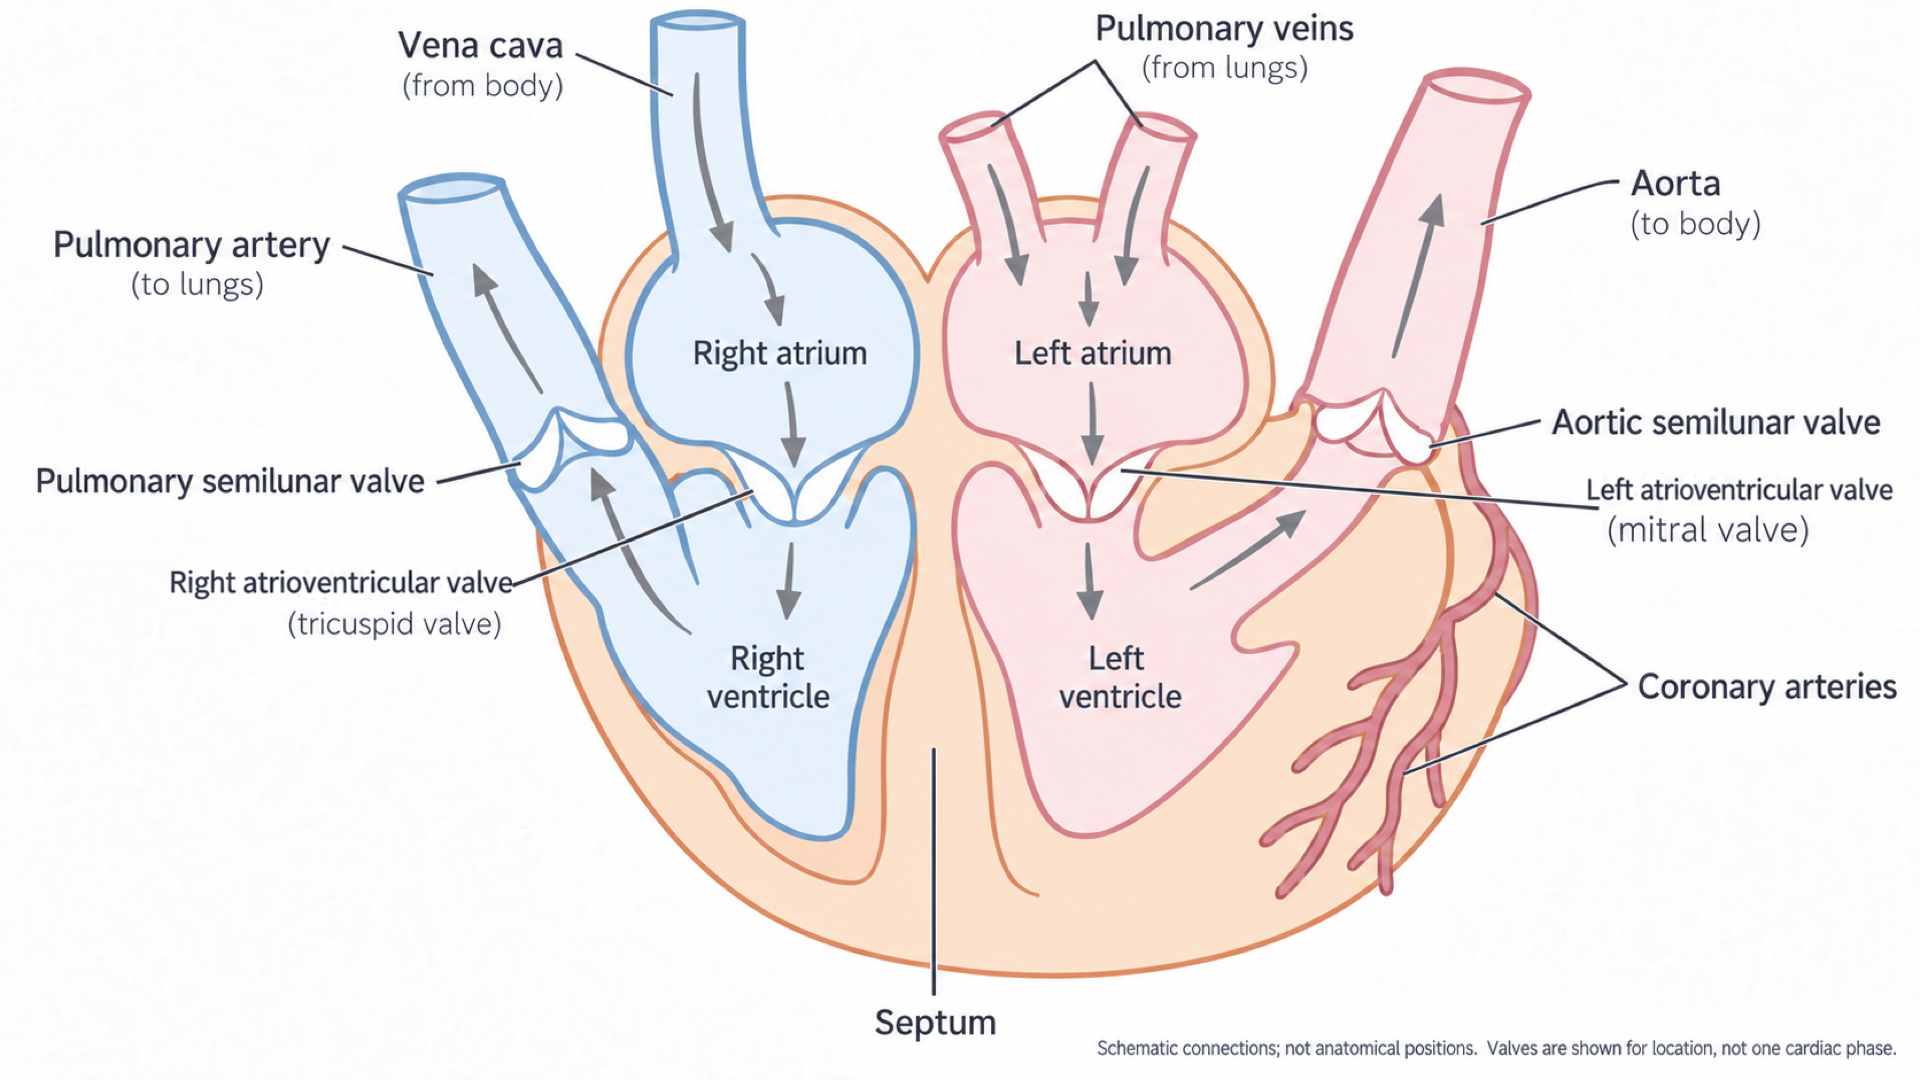
The heart's right side is on the left of this schematic. Pale blue shows lower oxygen content and pale rose higher; deoxygenated blood is dark red in life. Valves show position, not one moment in the cycle.
Vena cava → right atrium → right ventricle → pulmonary artery → lungs → pulmonary vein → left atrium → left ventricle → aorta → body → vena cava.
The septum prevents direct mixing between the two sides. Arteries carry blood away from the heart and veins carry blood towards it; those names do not specify oxygen content. The kidneys lie on a systemic branch: aorta → renal artery → kidney capillaries → renal vein → vena cava.
| Vessel | Connected to | Blood carried |
|---|---|---|
| Vena cava | Right atrium | Deoxygenated blood from the body |
| Pulmonary artery | Right ventricle | Deoxygenated blood to the lungs |
| Pulmonary vein | Left atrium | Oxygenated blood from the lungs |
| Aorta | Left ventricle | Oxygenated blood to the body |
| Coronary arteries | Branch from the aorta | Oxygenated blood to the heart muscle |
| Renal artery | Branch from the aorta | Blood to the kidneys |
| Renal vein | Leads to the vena cava | Blood from the kidneys |
Chambers, walls and valves
The atria have relatively thin walls and receive returning blood. The ventricles have thicker muscular walls and pump blood out.
Thicker muscle contracts with more force, so the left ventricle, with a much thicker wall than the right, generates the high pressure of the systemic circulation. The right ventricle pumps only to the nearby lungs, and its lower pressure does not damage the delicate capillaries.
Valves keep blood moving in one direction:
- Atrioventricular (AV) valves lie between the atria and ventricles and stop blood flowing back into the atria.
- Semi-lunar valves lie at the base of the aorta and pulmonary artery and stop blood flowing back into the ventricles.
Heart muscle is active all the time, and its wall is too thick for oxygen to diffuse into all of it from the chambers. The coronary arteries, branching from the aorta, give it its own blood supply.
Exam tip
When tracing a route, name each chamber, valve and vessel in order, and write “atrioventricular” in full, because “AV valve” can lose marks. Pulmonary arteries leave the heart; pulmonary veins return to it.
The cardiac cycle and pressure data
A single pressure rule explains when each valve opens and closes, and lets you read cardiac graphs in an exam.
The cardiac cycle is the repeating pattern of contraction (systole) and relaxation (diastole) that keeps blood moving through the heart.
The pressure rule
Valves respond passively: a valve opens when the pressure behind it is greater than the pressure in front, and closes when that reverses. This maintains unidirectional flow.
- Atrial pressure above ventricular pressure: atrioventricular valves open. Below it: closed.
- Ventricular pressure above arterial pressure: semi-lunar valves open. Below it: closed.
- Ventricular volume rising: blood entering. Falling: blood leaving. Constant while pressure changes: both sets of valves closed.
One cycle, step by step
Follow the left side of the heart from 0 s. The right side follows the same sequence at lower pressures.
[DIAGRAM: asset_name: transport-cardiac-cycle; asset_slug: transport-cardiac-cycle; recommended_method: retained_png; caption: Illustrative aligned graphs of left atrial, left ventricular and aortic pressure and left ventricular volume through one cardiac cycle.; description: Illustrative aligned graphs of left atrial, left ventricular and aortic pressure and left ventricular volume through one cardiac cycle.]
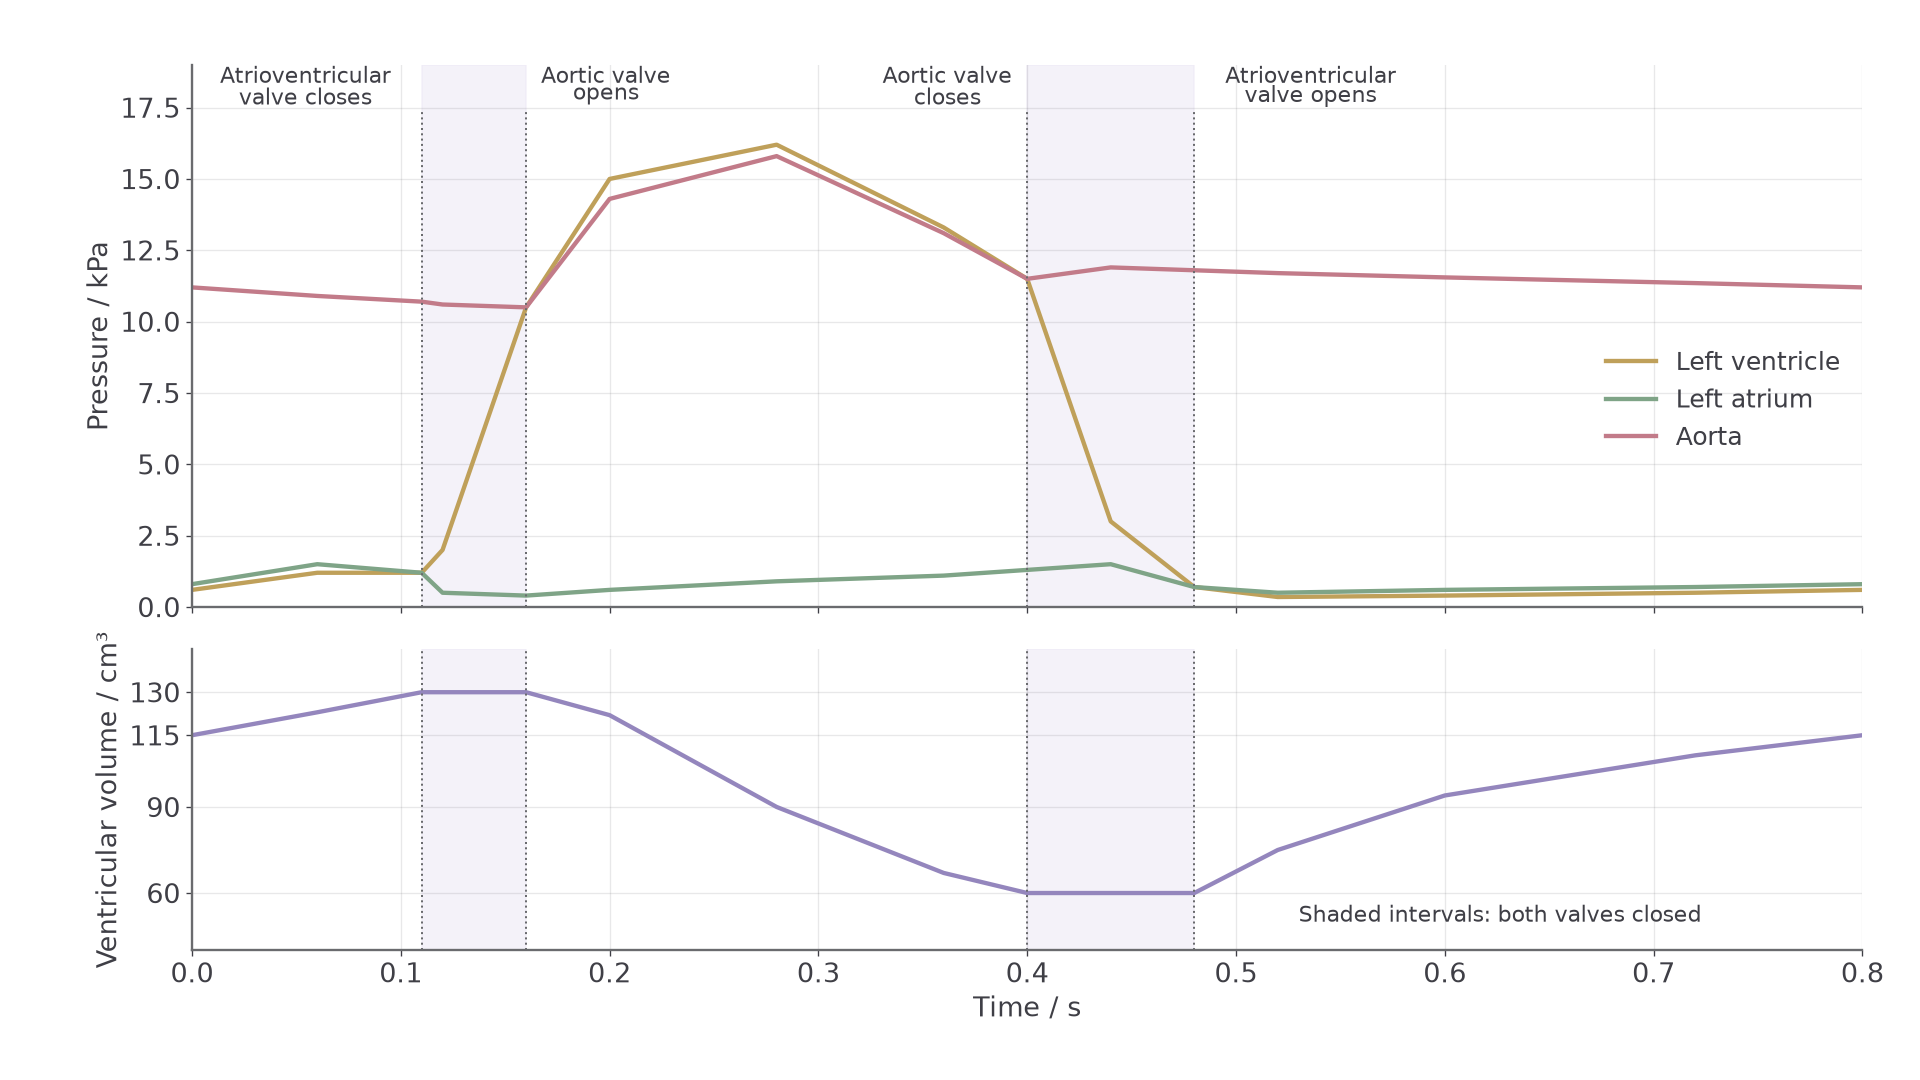
Values are a simplified teaching model.
- Atrial systole (to 0.11 s). Contraction raises atrial pressure, which pushes the final volume of blood through the open atrioventricular valves.
- Ventricular systole begins (0.11 s). Ventricular pressure rises above atrial pressure, so the atrioventricular valves close. It is still below arterial pressure, so the semi-lunar valves stay closed and volume is constant.
- Ejection (from 0.16 s). Ventricular pressure exceeds arterial pressure, so the semi-lunar valves open and blood is forced into the aorta and pulmonary artery.
- Relaxation begins (0.40 s). Ventricular pressure falls below arterial pressure, so the semi-lunar valves close and prevent backflow. The atrioventricular valves stay shut for a moment, so volume is constant again.
- Diastole (from 0.48 s). The atria and ventricles are relaxed. Ventricular pressure falls below atrial pressure, which rises slowly as blood returns. The atrioventricular valves open and the ventricles fill.
| Stage | Atrioventricular valves | Semi-lunar valves | Ventricular volume |
|---|---|---|---|
| Atrial systole | Open | Closed | Rising |
| Ventricular systole begins | Closed | Closed | Constant |
| Ejection | Closed | Open | Falling |
| Relaxation begins | Closed | Closed | Constant |
| Diastole | Open | Closed | Rising |
Reading a left-heart dataset
Table 1. Illustrative pressures at four successive points in the left side of the heart. This is not a real patient record.
| Point | Atrium / kPa | Ventricle / kPa | Aorta / kPa |
|---|---|---|---|
| A | 0.8 | 0.4 | 11.2 |
| B | 1.1 | 0.6 | 10.9 |
| C | 0.3 | 3.0 | 10.6 |
| D | 0.2 | 16.0 | 13.5 |
Ventricular volume at the same four points:
| Point | Volume / cm³ |
|---|---|
| A | 112 |
| B | 130 |
| C | 130 |
| D | 88 |
Worked example: valve positions at A, B and C
Plan: compare the pressures on each side of each valve, then check volume.
- Point A: atrial pressure exceeds ventricular pressure, so the atrioventricular valve is open. Aortic pressure is higher still, so the semi-lunar valve is closed.
- Point B: the valves are unchanged. Atrial pressure has risen, because atrial systole is pushing the last blood in.
- Point C: ventricular pressure (3.0 kPa) exceeds atrial pressure (0.3 kPa) but not aortic pressure (10.6 kPa), so both valves are shut.
Answer: C is the start of ventricular systole, a stage often missed.
Check: volume stays at 130 from B to C as pressure rises, so no blood has left.
Now read point D the same way.
Blood vessels and tissue fluid
Each vessel's structure fits the pressure it carries, and capillary pressure creates the fluid around your cells.
| Vessel | Key structural features | How this helps |
|---|---|---|
| Artery | Thick wall, lots of elastic tissue, lots of smooth muscle, relatively small lumen | Withstands high pressure and stretches and recoils as blood leaves the heart |
| Arteriole | Wall contains smooth muscle; lumen can be made narrower or wider | Controls blood flow into capillary beds |
| Capillary | Wall is one cell thick; very narrow lumen; numerous branches | Provides a short diffusion distance, large total surface area, and slow blood flow for exchange |
| Vein | Thin wall, large lumen, valves | Returns blood to the heart at low pressure and prevents backflow |
Continue this lesson.
You’re previewing NovaLearn without an account. Create a free account to read the rest.
Create free account