RP03 - Water potential of plant tissue
One sucrose concentration leaves a potato chip's mass unchanged. Make a dilution series, plot a calibration curve and use its intercept to find the water potential of the tissue.
Reading osmosis from mass change
A chip's change in mass shows which way water moved, and that points to the water potential of the tissue.
Water crosses the partially permeable cell-surface membranes of potato cells by osmosis, according to the water potential difference between the cells and the solution.
Water Potential
A measure of the tendency of water to move from one place to another. Pure water has a water potential of 0 kPa, and adding solute makes the value more negative.
So −800 kPa is lower than −400 kPa, and net water movement runs towards the lower value.
Osmosis
The net movement of water from a region of higher water potential to a region of lower water potential through a partially permeable membrane.
What each mass change shows
| Water potential of solution compared with tissue | Net movement of water | Mass of chip |
|---|---|---|
| Higher | Into the cells | Increases |
| Lower | Out of the cells | Decreases |
| Equal | None | No change |
You can read a mass change as water movement because sucrose is a large, polar molecule that crosses the cell-surface membrane far more slowly than water.
The last row is your target. A solution with the same water potential as the tissue is isotonic with it. With no water potential gradient, water molecules still cross the membranes in both directions, but at equal rates, so there is no net movement.
Published data give the water potential of a sucrose solution, so finding the solution that causes no mass change gives an estimate for the tissue.
Dilution series and method
You make six solutions of known concentration, then measure what each one does to the mass of a potato chip.
Dilution Series
A set of solutions with known concentrations made by mixing different volumes of a stock solution with a solvent.
Diluting from a stock solution
One workable method uses 1.0 sucrose stock solution and distilled water to prepare six 20 solutions.
| Sucrose concentration / | Volume of 1.0 sucrose / | Volume of water / |
|---|---|---|
| 0.0 | 0 | 20 |
| 0.2 | 4 | 16 |
| 0.4 | 8 | 12 |
| 0.6 | 12 | 8 |
| 0.8 | 16 | 4 |
| 1.0 | 20 | 0 |
For a direct dilution, the amount of sucrose is conserved:
Dilution equation
Here is concentration and is volume. Use the same units on both sides.
To make 20 of 0.3 , rearrange to get , then add 14 of water.
Serial dilution
Instead of making each solution separately from stock, a serial dilution transfers a measured volume into solvent, mixes, then uses that dilution to make the next.
For a twofold series, mix equal volumes of solution and water at each stage: 1.0, 0.5, 0.25 and 0.125 . For a tenfold step, use 1 part of solution to 9 parts of water, making 10 parts in total.
Mix before each transfer and pipette accurately, because an early error carries through every later dilution.
Exam tip
“Dilute with water” alone can lose the mark. State the volumes, for example 1 of solution and 9 of water for a tenfold step.
Measuring the change in mass
In the diagram, note the fixed steps in concentration and what stays the same: one chip per tube, one 30 °C water bath, the same measuring equipment.
[DIAGRAM: asset_name: RP 03 - Production of a dilution series of a solute to produce a calibration curve with which to identify the water potential of plant tissue - Diagram 1; asset_slug: RP 03 - Production of a dilution series of a solute to produce a calibration curve with which to identify the water potential of plant tissue - Diagram 1; recommended_method: retained_png; caption: Six labelled boiling tubes in a 30°C water bath, each containing a different sucrose concentration and one potato chip, with a balance and pipette shown alongside.; description: Six labelled boiling tubes in a 30°C water bath, each containing a different sucrose concentration and one potato chip, with a balance and pipette shown alongside.]
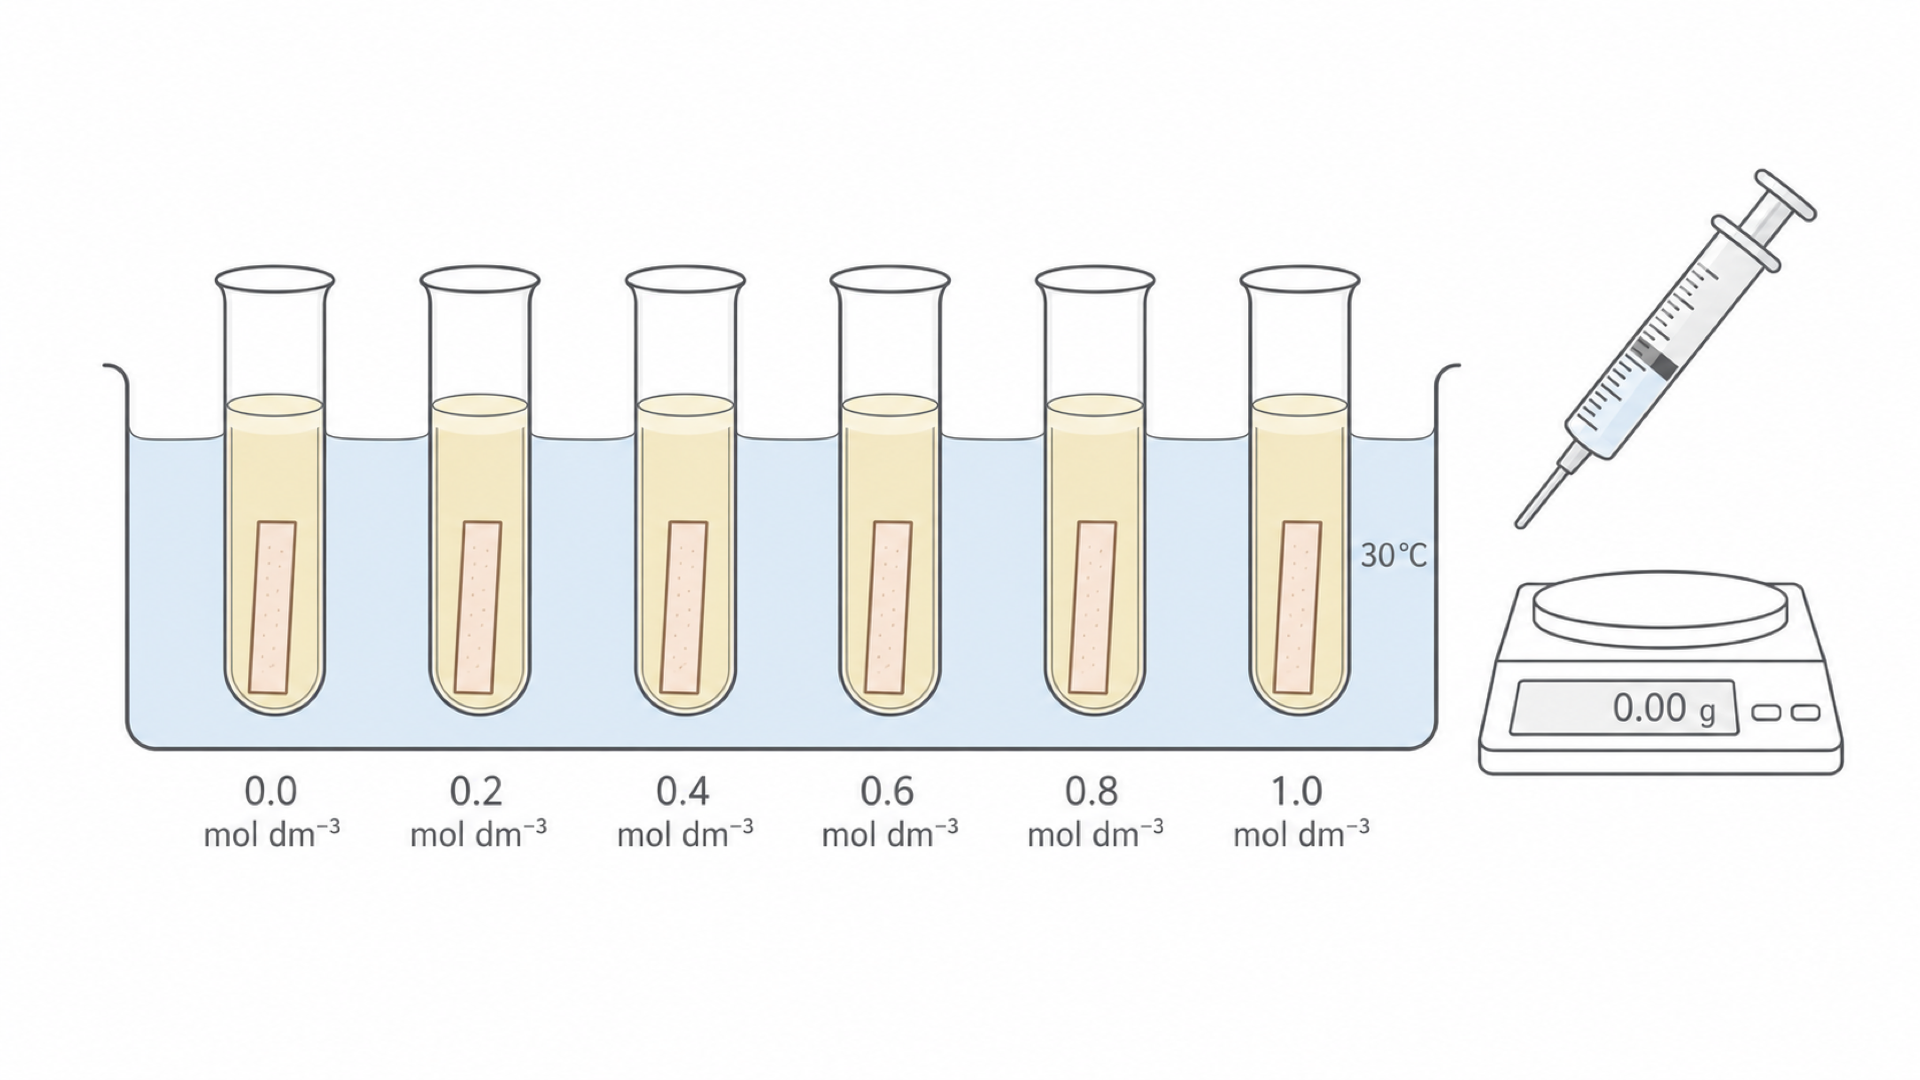
- Label six boiling tubes and add the volumes of sucrose solution and water with a graduated pipette or syringe, because the volumes set the concentration. Mix each tube so the concentration is even throughout.
- Stand the tubes in a 30 °C water bath and check with a thermometer, so each solution is at temperature before its chip goes in.
- Cut six chips from the same tuber with a potato chip cutter or cork borer and trim them to the same length, so tissue and size are comparable.
- Blot each chip without squeezing, then record its initial mass. Surface liquid would add mass, and squeezing would force water out.
- Put one chip in each tube for a fixed exposure time, such as 20 minutes, that gives a measurable change without tissue deterioration.
- Remove the chips, blot them in the same way and record their final masses.
- Repeat with at least three independent chips at each concentration, calculate each percentage change and then the mean, so one unusual chip has less effect.
Each concentration becomes an x-value on your graph, so a wrong volume moves a point and can shift your final estimate.
Variables and controls
Only sucrose concentration should differ between tubes, so every other influence on mass has to be held steady.
| Type of variable | What it is in this practical |
|---|---|
| Independent variable | Concentration of sucrose solution |
| Dependent variable | Percentage change in mass of the potato chip |
These control variables would otherwise change the result:
| Control variable | How to control it | Why it matters |
|---|---|---|
| Size of potato chips | Use the same cutter and trim to the same length | Different sizes have different surface area to volume ratios |
| Source of tissue | Cut all chips from the same potato tuber | Different potatoes can start with different water potentials |
| Volume of solution | Use the same volume in each tube | A small volume may change concentration as water enters or leaves the tissue; use sufficient solution to limit this |
| Temperature | Use the same water bath for all tubes | Temperature changes the rate of osmosis |
| Time in solution | Leave all chips for the same time | Longer immersion allows more change in mass |
| Blotting method | Dry all chips in the same way before weighing | Surface liquid would change the mass reading |
Why percentage change, not raw change
Potato chips rarely start with exactly the same mass, so raw changes can mislead: a 5.00 g chip gaining 0.20 g and a 2.50 g chip gaining 0.10 g have both changed by +4%. Percentage change in mass divides by initial mass, which standardises the results for fair comparison.
Continue this lesson.
You’re previewing NovaLearn without an account. Create a free account to read the rest.
Create free account