RP02 - Mitosis in root tips
A stained root-tip squash freezes cells at different moments of the cell cycle. Prepare one, name its stages, and use cell counts and calibrated measurements without mistaking a snapshot for a measure of growth.
Finding dividing cells in a root tip
Not every plant cell still divides, so this practical depends on sampling the right tiny piece of root.
Read the diagram from the right-hand end. The root cap protects the tip but is not the meristem. Just behind it lies the meristem, a plant region containing cells that divide repeatedly by mitosis. Further back, in the elongation zone, cells mostly lengthen and differentiate, so fewer are in mitosis.
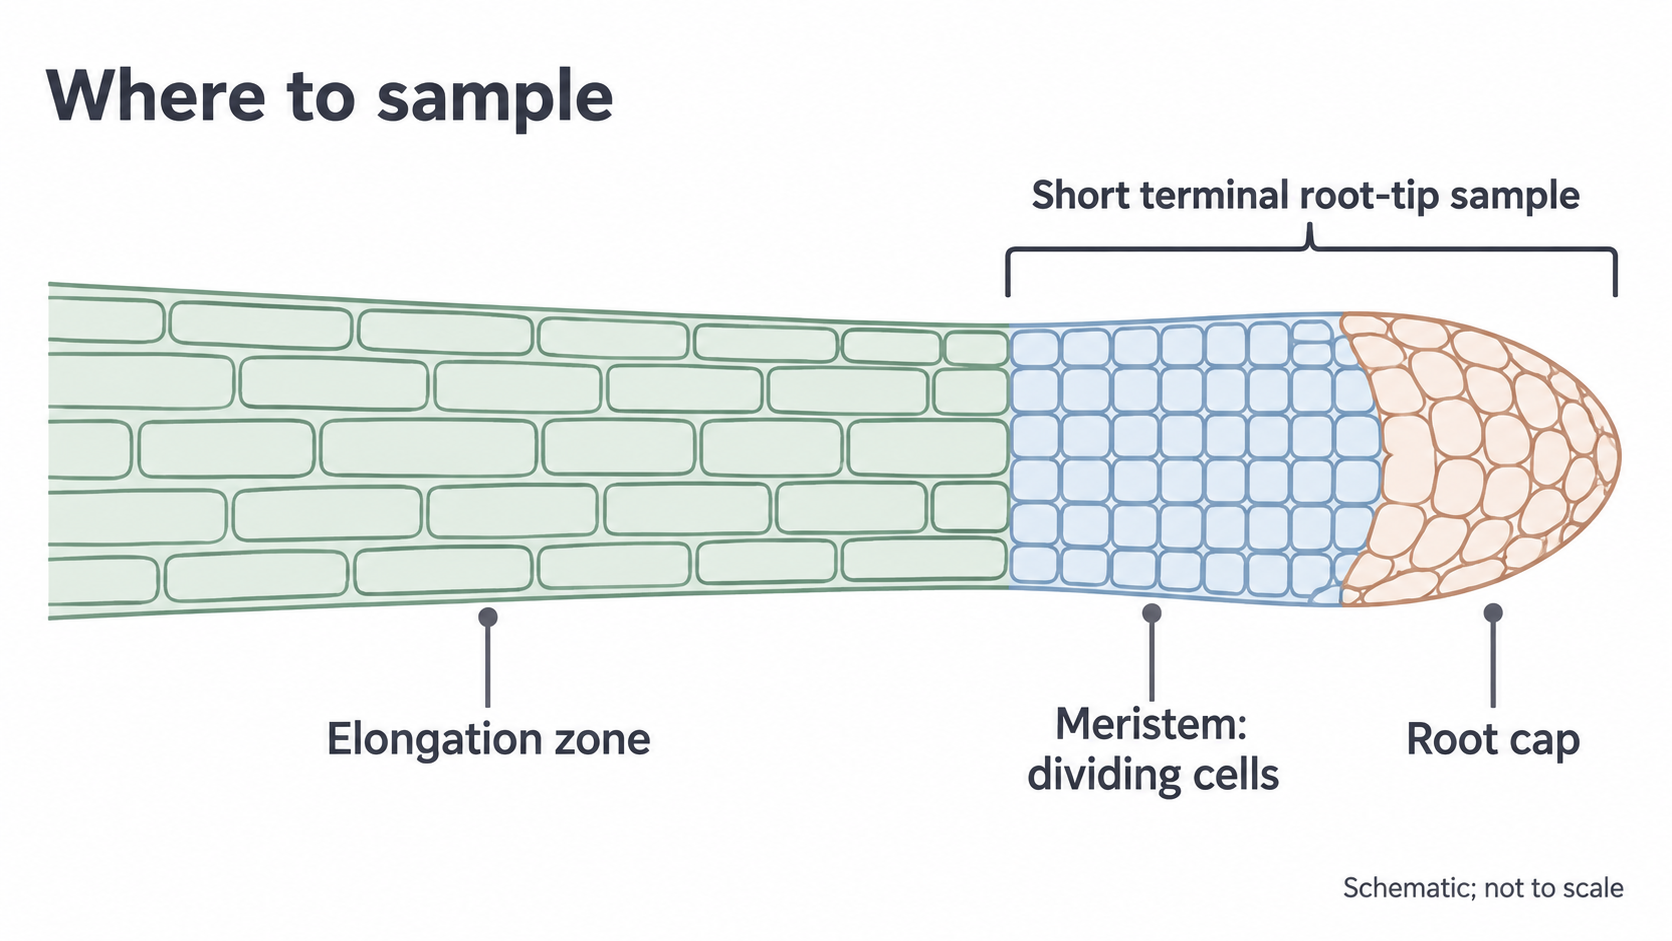
So take the short terminal region containing the meristem, commonly about 1–2 mm. This sample includes the root cap, so not every cell in it is meristematic.
A squash spreads this tissue thinly, so individual stained nuclei and chromosomes can be distinguished under an optical microscope. Mitotic index is the proportion of observed cells that are in mitosis, so you count cells, not chromosomes. A poor squash can hide cells and distort the index even when the arithmetic is correct.
Making a squash and using the microscope
Each method step fixes a specific problem: cells stuck together, pale chromosomes or tissue too thick to see through.
Treatment times and stain choice depend on the specimen and reagent, so follow your teacher's risk-assessed protocol. One school method uses fresh onion or garlic root tips, hydrochloric acid warmed to 60 °C, and toluidine blue O.
Preparing a thin stained squash
- Soften. Treat the root tip in the warm acid for about 5 minutes, or your centre's validated time. Acid softens the pectin-rich middle lamella, the layer that holds neighbouring cell walls together, so the cells separate. It also kills them, so you get a snapshot, not a live film of mitosis.
- Rinse and trim. Rinse off excess acid with water. Keep the 1–2 mm tip and remove most of the elongation zone.
- Stain. Add the prescribed stain on a clean slide. Positively charged toluidine blue binds to the negatively charged phosphate groups of nucleic acids such as DNA, so tightly packed chromosomes stand out dark. The acid is not the chromosome stain.
- Spread. Gently tease the tissue apart and lower a coverslip carefully to reduce trapped air. Press vertically through folded filter paper, following your centre's safe pressing procedure. Sliding sideways can distort or damage cells.
- Blot. Absorb excess stain. A thin layer lets light through and reduces overlapping cells, which greater magnification can't correct.
Microscope use and safety
- Secure the slide and start with a low-power objective, whose wider view makes the tissue easier to find. Centre a clear area, then adjust illumination and focus.
- Watch from the side as the objective nears the slide, so it can't hit the coverslip.
- Move to higher power and use the fine focus, because coarse focusing risks driving the lens into the slide.
- Record the objective and eyepiece magnifications. Their product is the total magnification.
| Hazard | Precaution |
|---|---|
| Acid or stain reaching eyes or skin | Wear eye protection and avoid skin contact |
| Warm acid spilling | Handle it with suitable tools and keep the water bath stable |
| Cutting tissue | Cut on a suitable surface away from fingers, using forceps to hold tissue |
| Broken slides and coverslips | Handle slides by their edges and put broken glass in the designated container |
In a method answer, tie each precaution to its hazard: “wear eye protection because acid can injure eyes”, not just “be careful”.
Identifying stages and drawing cells
Name a stage from what you can see, then explain that appearance from what the chromosomes are doing.
Evidence for each stage
| Stage | What you see | Why it looks like that |
|---|---|---|
| Interphase | Intact nucleus, with no separate condensed chromosomes | DNA is present as less-condensed chromatin; replication occurs during S phase |
| Prophase | Short, thick dark threads or clumps, not yet aligned | Chromosomes condense, so they become visible; the nuclear envelope breaks down and spindle fibres begin to attach to centromeres |
| Metaphase | Chromosomes across the equator | Spindle fibres attached to centromeres position the replicated chromosomes for separation |
| Anaphase | Two separating groups, sometimes with V-shaped chromosomes | Centromeres have divided; spindle fibres shorten and pull sister chromatids to opposite poles, centromere first, so the arms trail in a V. The separated chromatids are now chromosomes |
| Telophase | Two chromosome groups at opposite poles, with nuclei reforming | Chromosomes uncoil and new nuclear envelopes form |
| Cytokinesis | A cell plate developing between two daughter nuclei | The cytoplasm divides; in plant cells vesicles form a cell plate that develops into a new cell wall, not an animal-cell cleavage furrow |
Telophase and cytokinesis can overlap, so a cell with a cell plate may also be in telophase.
Watch out
In anaphase of mitosis, sister chromatids separate. Writing that homologous chromosomes (matching pairs) move to opposite poles can lose the mark.
Real specimens vary in orientation, staining and focus, so some cells can't be assigned confidently. A view along the spindle axis can show metaphase chromosomes as a cluster rather than a neat side-on line. Use several features and fine focus, and don't invent spindle fibres or centromeres that the preparation cannot resolve.
Scientific drawing from observation
Choose a clear cell actually visible in your preparation and record its stage with a reason.
- Outlines: draw large, with a sharp pencil and single clear lines. Avoid shading and sketchy repeated lines.
- Accuracy: match relative sizes and positions. Don't copy an idealised diagram or add invisible organelles.
- Labels: use straight ruled lines that meet the structure and don't cross.
- Title and scale: identify the specimen and view, and record the magnification or a calibrated scale bar.
- Annotations: an annotation adds biological meaning to an observation, for example “two chromosome groups moving apart: anaphase”.
In your notebook, draw and annotate an observed dividing cell and an interphase cell, recording the stain, magnification and date.
Mitotic index and stage duration
A squash is one frozen moment, yet counting its cells lets you estimate how long each stage lasts.
Calculating the index
Use a tally for interphase and each mitotic stage.
Mitotic index
The numerator includes prophase, metaphase, anaphase and telophase. The denominator includes all counted cells, including interphase.
Worked example: mitotic index and prophase fraction
A sample contains 120 interphase, 24 prophase, 8 metaphase, 4 anaphase and 4 telophase cells. Find the mitotic index and prophase fraction.
Plan: add the mitotic stages, add interphase for the total, then divide.
- Cells in mitosis:
- Total cells:
- Mitotic index:
- Prophase fraction:
Answer: mitotic index 0.25 (no unit); prophase fraction 0.15.
Check: the interphase fraction is , and .
Prophase is also of the cells in mitosis, so check which total a question means.
Exam tip
Give mitotic index as a proportion between 0 and 1 unless the question or axis uses a percentage (here, 25%): multiplying by 100 can lose the mark. So can counting chromosomes rather than cells.
From cell counts to stage duration
Meristem cells divide asynchronously, not in step. So when the acid kills them they are scattered across the whole cycle, and a longer stage holds more cells at that moment. The proportion of cells at a stage therefore approximates the proportion of cycle time spent there.
With a 20-hour cycle, the example gives prophase hours and interphase hours. Cells spend most of the cycle in interphase, so most cells in your squash will not be dividing. Among the mitotic stages, the largest count probably marks the longest stage: here, prophase.
This assumes the cells are actively cycling at a steady rate and the sample is representative. It fails if many cells have stopped cycling or a treatment arrests them at one stage. It is also a population average, because times vary between individual cells. A snapshot measures occupancy, not duration directly.
Measuring cell size
A cell's image can be almost any size, so compare cells by actual size, not by how big they look.
The length you measure on an image is its apparent size. Measure a clear non-overlapping cell across a defined dimension, such as its width.
You met this formula in 3.2.1.3.
Actual size
Measure the image at the size for which its magnification was specified, and convert using 1 mm = 1000 μm.
Worked example: actual width from an image
A cell image is 12 mm wide at ×600. Find the cell's actual width in micrometres.
Plan: divide image size by magnification, then convert to micrometres.
Answer: 20 μm.
Check: .
A photomicrograph, a photo taken through a microscope, may have been resized, so use a scale bar that resized with it. A cell 3 times the length of a 10 μm scale bar is 30 μm long regardless of screen zoom.
Calibrating the eyepiece graticule
You calibrated an eyepiece graticule in 3.2.1.3: its divisions have no units until compared with a stage micrometer.
- At your chosen objective, align the graticule with the micrometer and count divisions over a long span, which reduces the effect of a reading error.
- Divide the known distance by the number of divisions. If 40 divisions span 100 μm, one division is 2.5 μm.
- Replace the micrometer with the root-tip slide without changing the objective.
- Multiply the cell's span by the length per division. A 16-division cell is .
Recalibrate after changing objective: the eyepiece scale stays the same while the specimen image changes size, so each division represents a different real distance. Record the calibration alongside your measurements.
Reliable counts and valid conclusions
A large count can still be biased, and a high index doesn't always mean faster growth.
What a mitotic index can and can't show
A high mitotic index can reflect more cells entering mitosis, but it can also reflect cells remaining in mitosis longer. For example, a spindle-blocking drug may prevent anaphase, so metaphase cells accumulate even though fewer divisions finish.
The index shows where cells are at one moment, not how many divisions finish per hour, so don't automatically equate a high index with faster growth.
Exam tip
For a graph of mitotic index against distance from the root tip, describing the trend alone can lose marks. Link it to cells: a larger proportion in mitosis nearer the tip, and a larger proportion in interphase further away.
Sampling and comparing fairly
Choosing only fields with dramatic mitotic figures pushes the index up, however many cells you count. Instead:
- Move through the meristem using a predefined non-overlapping pattern or randomised fields.
- Count all suitably visible cells using the same rule in each field. For example, count cells touching the top and left borders but exclude those touching the bottom and right, to avoid counting them twice.
- Keep the criterion for identifying mitosis consistent, and record the number of cells sampled as well as the final index.
- Record cells that overlap or can't be classified, then improve the preparation, because quietly omitting difficult cells may bias the stage frequencies.
| Observation | Plausible cause | Targeted improvement |
|---|---|---|
| Mostly elongated cells and few mitotic figures | Tissue sampled too far behind the meristem | Select the terminal region containing the meristem |
| Overlapping cells | Squash too thick | Tease apart and spread a thinner layer safely |
| Very faint chromosomes | Insufficient contrast or focus | Check stain protocol, illumination and fine focus |
| Index varies between fields | Sampling variation or different root regions | Use consistent region, more unbiased fields and independent roots |
Repeat across several independently prepared root tips: more fields improve sampling within one root, while more roots test biological repeatability.
For a treatment comparison, use comparable plant material and root regions, a suitable untreated control, and the same exposure time, temperature, preparation and counting procedure. Record variation rather than claiming a difference from two isolated indices. To test for faster growth, measure root length over time in treated and control roots.