3.4.6 - Biodiversity within a community
Two fields can hold the same 25 plant species and still differ hugely in diversity. Learn the number that shows it, how far to trust it, and how to weigh farming against conservation.
What biodiversity means
Counting species is a useful start, but it hides how the individuals are shared between those species.
A community contains populations of different species living and interacting in the same area. Biodiversity describes the variety of life at a stated scale, from a small local habitat, such as a pond, to the whole Earth.
Biodiversity
The variety of living organisms in a particular area.
Biodiversity has three useful levels:
- Species diversity: the variety of species and the abundance of each species in a community
- Genetic diversity: the number of different alleles of genes in a population, as in 3.4.4
- Ecosystem diversity: the range of different habitats in an area
Richness and evenness
Picture two fields that each contain 25 species of plant. In a meadow, those species grow in fairly even numbers. In a crop field, one species dominates and the other 24 are represented by only a few individuals.
Species richness
A measure of the number of different species in a community.
The two fields have the same species richness, yet they are clearly not equally diverse, because richness does not show whether the species are present in similar numbers. How evenly the individuals are shared out between the species is called evenness, and species diversity takes it into account where richness does not.
Look at the two bar charts: both communities contain five species and 50 individuals.
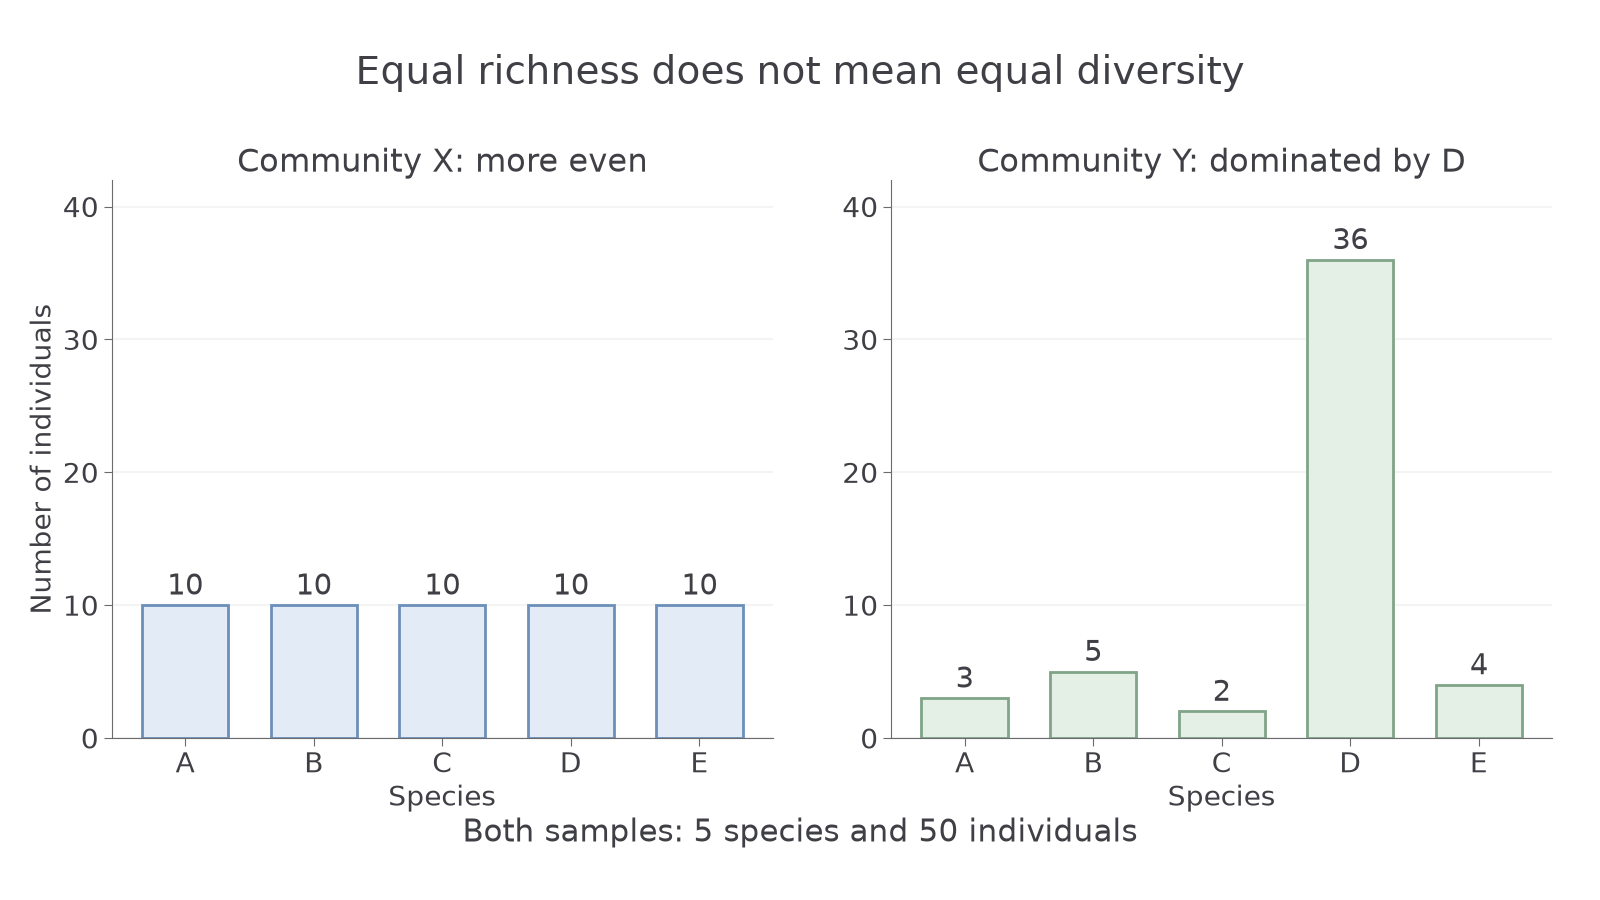
Richness cannot separate them, but the bars can: X is even at 10 per species, while in Y species D makes up 36 of the 50 individuals.
Calculating an index of diversity
One number can capture both richness and evenness, and four steps get you there.
Index of diversity
A numerical value that describes the relationship between the number of species in a community and the number of individuals in each species.
The formula you need is:
Index of diversity
Where:
- = index of diversity
- = total number of organisms of all species
- = total number of organisms of each species
- (sigma) means "the sum of"
To calculate the index:
- Add up all individuals to find , then work out the numerator, .
- Calculate for each species.
- Add those values to find the denominator, .
- Divide the numerator by the denominator.
Watch out
is the total number of individuals, not the number of species. Also, adding the counts first and doing once just gives again, so comes out as 1. Work out for each species, then add.
Apply those steps to the bar-chart communities.
Worked example: communities X and Y
Question. Calculate for X and Y.
Plan. Both have = 50, so both numerators are 50 × 49 = 2450. Only the denominators differ.
Community X. Each of the five species gives 10 × 9 = 90, so the sum is 450.
Community Y.
| Species | ||
|---|---|---|
| A | 3 | 6 |
| B | 5 | 20 |
| C | 2 | 2 |
| D | 36 | 1260 |
| E | 4 | 12 |
| Total | = 50 | 1300 |
Answer. X has = 5.44 and Y has = 1.88.
Check. With equal numerators, Y's larger denominator must give the smaller index.
With the same richness and total count, X has the higher index because its individuals are spread more evenly across the species.
Interpreting what the index tells you
An index is only worth quoting if you can say why it is high or low and what the sample behind it covers.
A higher means higher diversity, and the formula shows why. Imagine choosing two individuals at random, one after the other: counts every possible pair, and each counts the pairs both from that species. So is all pairs divided by same-species pairs.
In Y, 1300 of the 2450 pairs are same-species pairs, and 1260 of those are both species D. In X, only 450 are. So when one species dominates, the denominator is large relative to the numerator and is low.
When you read a value:
- The lowest possible value is , when all individuals belong to one species and .
- The index has no unit.
- Neither 1 nor richness is an upper limit: X gives 5.44 from five species.
- The largest total population or largest single-species count does not decide diversity.
A higher index matters because individuals are spread across more species, or more evenly, so consumers have more possible food sources. If one species declines, the rest of the community is less likely to be badly affected, so a more diverse community tends to be more stable.
The alternative convention
Some sources use a Simpson's index on a 0 to 1 scale. AQA's maths skills list gives as an example of using a given equation, which gives 0.80 for X. Another version is:
This equals , so X gives 0.816, not 5.44. Both measures increase with evenness, but their scales differ. Use the formula you are given, and never compare values calculated with different formulas.
What a sample can support
An index summarises only the organisms counted, often in quadrats: square frames of fixed area. Three choices decide how far to trust those counts:
- Random positions: random coordinates reduce the selection bias of a conveniently chosen spot.
- Many quadrats: replication reveals variation and reduces the influence of chance, so the data are more representative.
- Comparable methods: equal sample area, effort, timing and identification make habitat comparisons fair.
Even so, a higher sample index does not prove greater diversity across a whole region: a few samples on one date can miss other areas and seasonal species. Nor does an index alone prove stability or explain the cause of a difference.
Continue this lesson.
You’re previewing NovaLearn without an account. Create a free account to read the rest.
Create free account