RP07 - Chromatography of leaf pigments
Separate the pigments hidden in a leaf, explain why they travel different distances, and judge what your results can and cannot prove.
Leaf pigments and what to compare
A green leaf hides yellow and orange pigments; this practical separates them so you can compare plants.
Each photosystem from 3.5.1 holds several photosynthetic pigments:
- Chlorophyll a (blue-green) is the main pigment associated with the reaction centres, the parts of each photosystem where photoionisation happens.
- Accessory pigments, including chlorophyll b (yellow-green), carotene (orange-yellow) and xanthophylls (yellow), broaden the range of light wavelengths that can be absorbed for photosynthesis. Energy they absorb can be transferred to chlorophyll a.
A healthy leaf usually looks green because chlorophylls are the most abundant pigments, so their green hides the yellow and orange of the others. In autumn, chlorophyll breaks down in many leaves and those pigments, present all along, show through.
What you are comparing
The investigation compares pigments from leaves of different plants, such as shade-tolerant and shade-intolerant species, or leaves of different colours. Shade-tolerant plants often grow beneath leaves that have already absorbed much of the red and blue light. A different mixture could absorb more of what is left, so one hypothesis is that the mixtures differ.
Choose comparable mature leaves and record the species and growth conditions, because leaf age and health could otherwise explain an apparent difference. Sample several plants in each group: multiple discs from one leaf improve repeatability for that leaf but do not represent independent plants.
What the bands can tell you
Pigments travel up the paper at different rates, so one green spot spreads into separate bands. The number of visible bands is a minimum count of pigment components: two substances may travel together, and a low-concentration pigment may be below the detection limit. A missing band is therefore weaker evidence than a clear, reproducible difference.
Preparing and running the chromatogram
Learn this method as a chain: each step comes with the error it prevents.
Leaf pigments sit in the thylakoid membranes and dissolve poorly in water, so the solvent is organic. AQA's example uses propanone and petroleum ether, which are volatile and highly flammable. Wear eye protection and work in a ventilated area, away from ignition sources.
Running a chromatogram
- Measure equal solvent volumes into boiling tubes or chambers with graduated glassware (AQA's sheet uses 3 ), then close them. Solvent vapour saturates the atmosphere inside, reducing evaporation from the paper, which would otherwise slow the rising solvent and make its front uneven.
- Rule a pencil line about 2 cm from the bottom of the paper. This origin is the baseline you used for sugars in 3.1.2. Pencil graphite remains at the line, whereas soluble ink would run and introduce extra pigments.
- Cut equal-sized discs with a cork borer, with the leaf on a tile and fingers clear of the edge. Avoid the midrib and major veins, which are mostly transport tissue, so discs stay comparable.
- Crush the disc onto the centre of the origin with a glass rod, leaving a small concentrated stain. A small start gives narrow bands that stay separate.
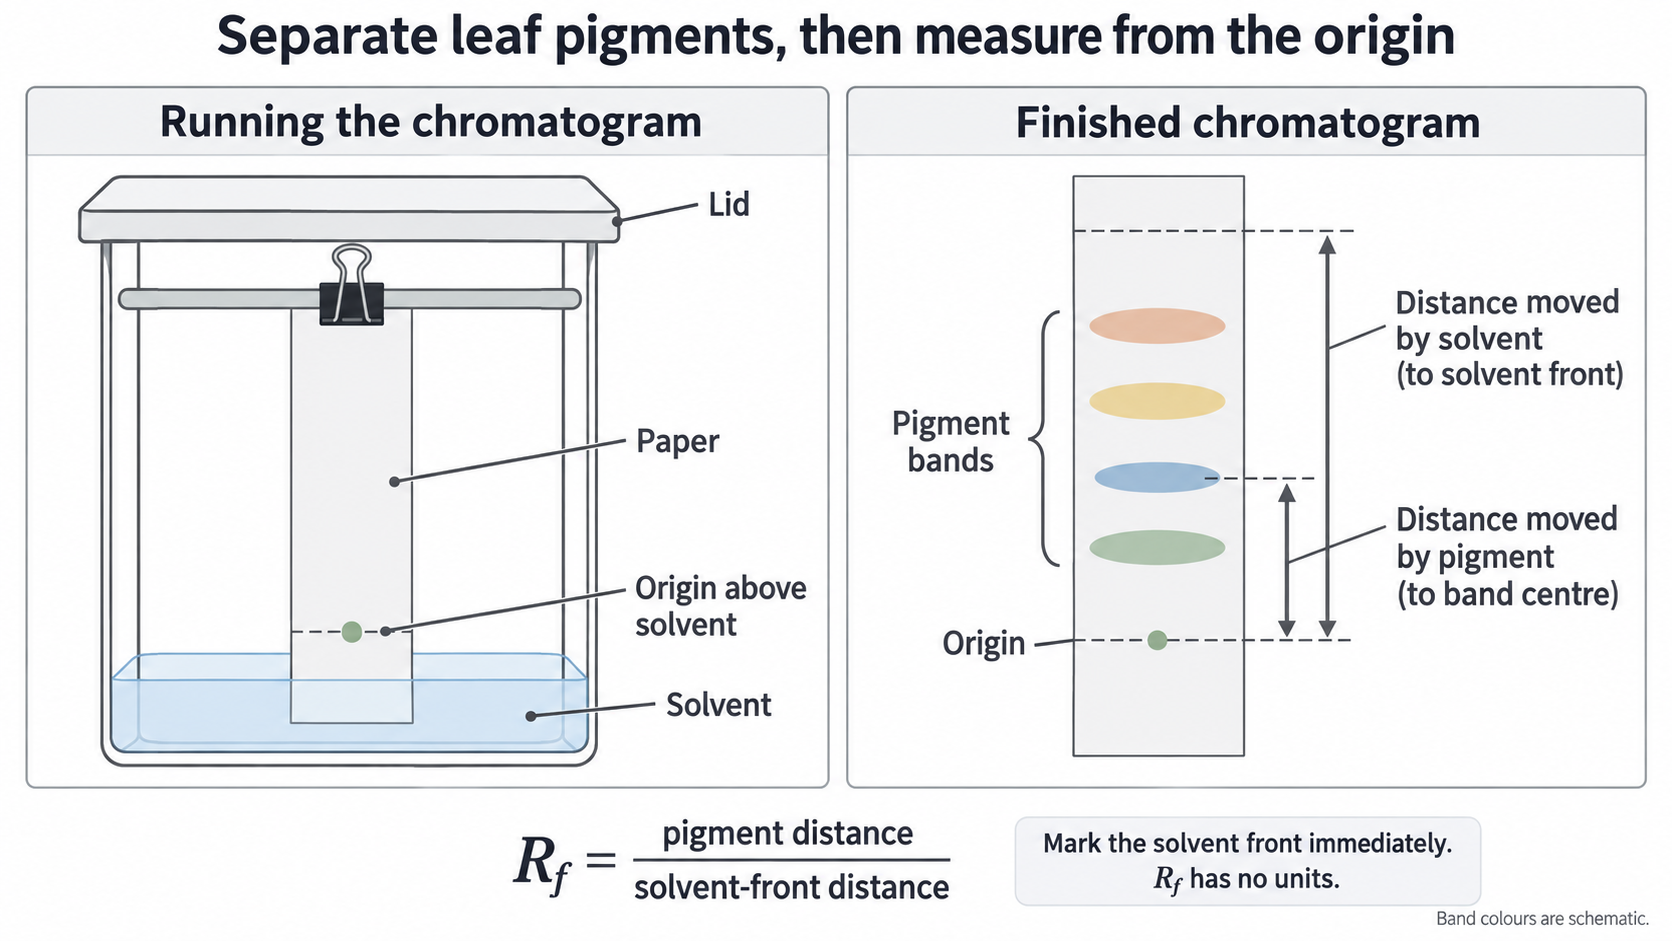
- Suspend the paper with its bottom in solvent, the origin above the solvent surface and the paper clear of the walls. A submerged spot would dissolve into the reservoir instead of starting at a narrow line, and touching the walls makes the front uneven.
- Close the tube and let the solvent rise without moving it. Remove the strip before the front reaches the top, or you can no longer tell how far the solvent travelled.
- Draw the solvent front in pencil immediately, because the solvent evaporates and its position cannot be recovered reliably. Then mark the band centres or outlines, because pigments fade quickly.
Check your set-up against the left panel; the right panel shows both distances starting at the origin.
[DIAGRAM: asset_name: chromatography-method; asset_slug: chromatography-method; recommended_method: imagegen; caption: Covered chamber with origin above solvent, and developed paper showing pigment-centre and solvent-front distances measured from one origin.; description: Covered chamber with origin above solvent, and developed paper showing pigment-centre and solvent-front distances measured from one origin.]
Extracts, repeats and faults
An extract gives more control over the amount loaded than a crushed disc. Grind a measured mass of leaf in a fixed solvent volume, filter out the tissue, and apply equal small volumes of extract at the origin with a capillary tube. Letting each application dry before the next keeps the spot narrow and concentrated.
Use the same extraction and loading method for every comparison, not a crushed disc against an arbitrarily diluted extract. Repeat with separately prepared samples, and look for these faults:
| Fault | Cause and effect | Improvement |
|---|---|---|
| Broad or streaked bands | A wide or overloaded spot makes band centres uncertain | Use a smaller spot and dry between applications |
| Very faint bands | Too little pigment to see | Use a more concentrated extract |
| Sloping front | Uneven paper contact or solvent movement | Rerun with the paper clear of the walls; do not invent a horizontal front |
Continue this lesson.
You’re previewing NovaLearn without an account. Create a free account to read the rest.
Create free account