3.2.1.3 - Studying cells
Why can a light microscope show a cell but not its ribosomes? Learn to measure cells, judge the detail an image can support, and isolate organelles intact.
Magnification and resolution
A bigger image is not always a better one: magnification enlarges, but only resolution reveals detail.
Zoom in on a phone photo and you soon get larger blocks, not new detail. Under a microscope, likewise, a large blurred patch is not evidence of fine detail.
Magnification and resolution
Magnification is how many times larger the image is than the real object: the ratio of image size to actual size.
Resolution is the ability to distinguish two close points as separate.
Enlarging an image captures no new information, so merged points stay merged: magnification rises, resolution does not. A smaller minimum resolvable distance means better resolving power: a microscope resolving 20 nm separates closer points than one resolving 200 nm.
Using the magnification formula
Magnification
is image size, is actual size and is magnification. Rearranged, and .
Use the same length unit for and , so the units cancel and magnification has no unit, as in ×4000. For a fixed actual size, : doubling magnification doubles image size.
Units and standard form
A micrometre is ; a nanometre is . Moving to a smaller unit makes the number larger, so .
Standard form is , where and is an integer. Keep the original precision: 0.0050 mm becomes , not .
Worked example: finding magnification
An image 20 mm long shows a structure actually 5.0 μm long. Calculate the magnification.
Plan: convert to one unit, then divide image size by actual size.
- 20 mm = 20 000 μm
Answer: ×4000, or .
Check: 5.0 μm × 4000 = 20 000 μm = 20 mm.
Going the other way, a 15 mm image at ×750 represents . Write to signal rounding rather than an exact count.
Scale bars and orders of magnitude
A scale bar stays valid when an image is resized, because bar and image change together. If a printed 10 μm bar measures 5 mm and the cell measures 12 mm, the cell is long. A printed magnification label becomes invalid if the image is resized without updating it.
An order of magnitude is a factor of ten. A typical 20 μm cell is about ten times the length of a 2 μm bacterium: one order of magnitude. It is about 100 times a 0.2 μm particle: two orders.
A ribosome of about 20 nm is three orders smaller: , where means "much less than". Powers of ten also check a calculator result: a whole animal cell is unlikely to have a diameter of 20 nm.
The optical microscope and measuring size
Light and glass lenses can show you living cells, and a calibrated scale turns what you see into real sizes.
The principle and its limit
An optical (light) microscope passes visible light through a specimen and focuses it with glass lenses. In a compound microscope the objective forms a magnified image and the eyepiece magnifies it further. Total magnification is objective magnification multiplied by eyepiece magnification: a ×40 objective and ×10 eyepiece give ×400.
Thin specimens allow transmitted light through; thick overlapping tissue hides individual cells. A stain increases contrast between structures. The main advantage is that natural colour and living specimens can be observed, provided preparation has not killed them.
The main limitation is resolution. Visible light has a relatively long wavelength (about 400–700 nm), and two points closer than about half the wavelength cannot be distinguished. For conventional light microscopy the minimum resolvable distance is therefore about 0.2 μm (200 nm), so ribosomes and membrane fine structure cannot be resolved at any magnification.
Calibrating a graticule
An eyepiece graticule has an arbitrary scale: its divisions are not micrometres until calibrated. A stage micrometer is a slide with known distances between marks.
- Focus the stage micrometer using the objective that will measure the cells. Align one mark on each scale.
- Find another pair of coincident marks well apart. Count the intervals between marks on each scale, not the marks themselves.
- Divide the known micrometer distance by the number of graticule divisions spanning it.
- Replace the micrometer with the specimen, keep the same objective, measure the cell in graticule divisions, then multiply by the calibration.
Here the two scales line up at 0 and at their right-hand ends.
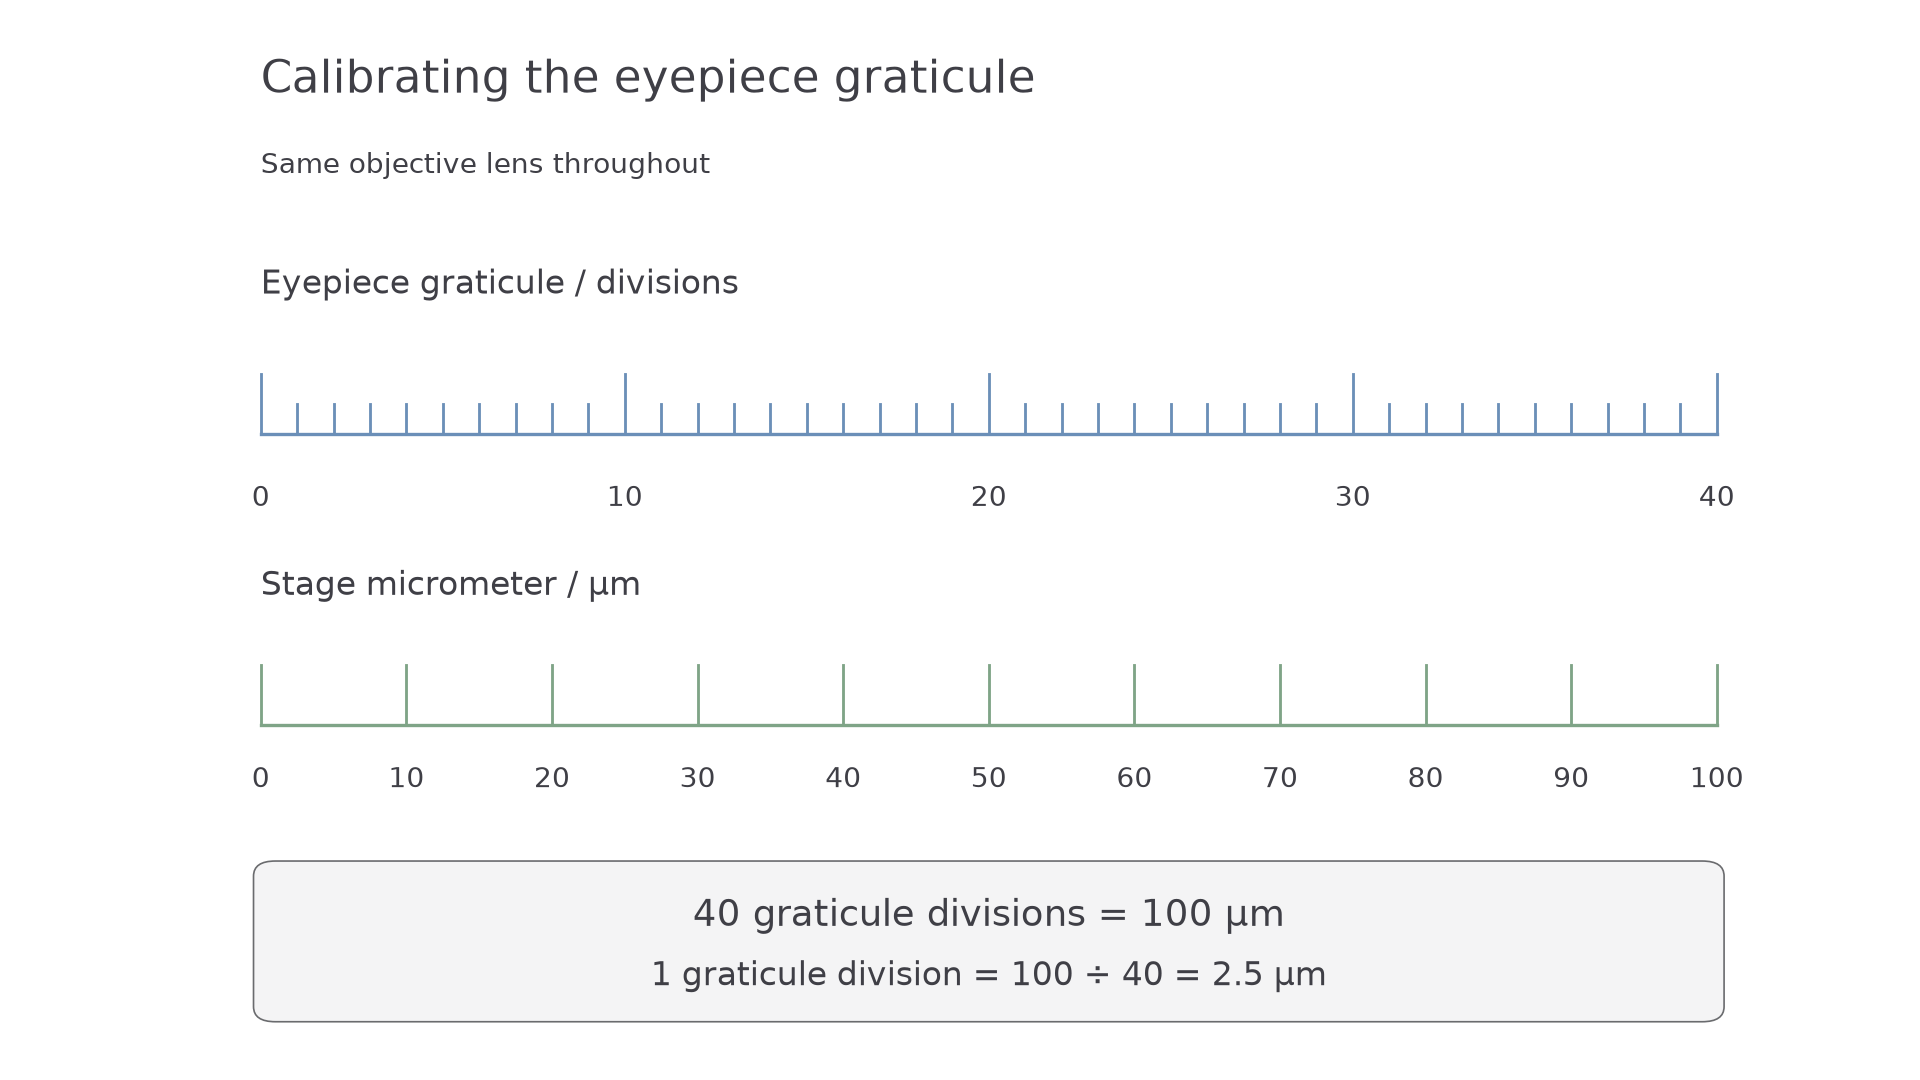
So 40 graticule divisions span 100 μm, and each division represents . A cell spanning 12 divisions is long.
Recalibrate whenever the objective changes. The physical eyepiece scale stays the same, but the specimen image changes size relative to it, so one division represents a different actual length. To estimate typical size, measure several clear cells, recording calibration, units and sensible precision.
Electron microscopes
Electrons resolve far smaller structures than light, at a price: dead specimens and possible artefacts.
Electrons have a much shorter wavelength than visible light, so electron microscopes can distinguish much smaller structures. Both transmission and scanning types focus electrons with electromagnetic lenses and conventionally work under vacuum, because air would scatter the beam. The vacuum and specimen preparation rule out living cells in the ordinary methods studied here.
How TEM and SEM differ
A transmission electron microscope (TEM) passes electrons through an extremely thin section, because electrons cannot pass through a thick specimen. Regions that scatter or absorb more electrons appear darker. The result is a two-dimensional section through internal ultrastructure, the fine detail inside a cell that optical microscopes cannot resolve.
A scanning electron microscope (SEM) scans a focused beam across the surface and detects emitted electrons. This produces an image with a three-dimensional appearance that reveals surface topography. A surface view does not reveal internal organelles unless they have first been exposed or isolated.
| Feature | Optical microscope | TEM | SEM |
|---|---|---|---|
| Radiation | Visible light | Electrons | Electrons |
| Conventional specimen | Thin living or prepared tissue | Fixed, very thin section | Prepared surface, often metal coated |
| Information | Cells/tissues and colour | Internal ultrastructure in a section | Surface topography |
| Resolving power | Lower | Generally highest of these three | Usually below TEM, above optical |
| Output | Colour can be observed | Greyscale; colour may be added later | Greyscale; colour may be added later |
| Main limitations | Resolution about 0.2 μm | Non-living, very thin specimen; flat image; artefacts | Non-living specimen; surface only; artefacts |
Exact resolution depends on instrument and preparation, so use values supplied in a question.
Watch out
Higher magnification alone does not explain why one microscope reveals a smaller structure. Higher resolution does, and here it comes from the shorter wavelength of electrons.
Artefacts and reliable observations
Fixation, dehydration, sectioning, staining and coating may distort or shrink structures.
Artefact
An artefact is an apparent structure or alteration caused by preparation or imaging, rather than being present in the original living cell.
A dark patch in one preparation is therefore not automatically a new organelle. Scientists spent a considerable period distinguishing organelles from artefacts: ordinary electron microscopy cannot show the living cell, so early images could not be checked against the original, and confirmation had to wait for other preparation methods.
The errors ran both ways:
- A real organelle doubted: the Golgi apparatus, described in 1898, was suspected of being a staining artefact until electron microscopy settled the debate in the 1950s.
- An artefact believed: mesosomes, folds in bacterial membranes, were thought real for years, until methods avoiding chemical fixation, such as rapid freezing, showed they were artefacts.
Repeated observations across cells, preparations and independent methods strengthen a claim that a structure is real. A supposed structure found with only one preparation raises doubt.
Cell fractionation and ultracentrifugation
Microscopes locate organelles; fractionation isolates them so you can test what they do.
Cell fractionation separates cell components so that their biochemical activities can be investigated.
Release and protect organelles
Homogenise tissue to break open cells and release organelles, then filter out large tissue pieces, unbroken cells and debris. The suspension of released components is the homogenate. Use a cold, buffered, isotonic solution throughout:
| Condition | Biological reason |
|---|---|
| Ice-cold | Slows enzyme activity, including hydrolytic enzymes that could digest organelles |
| Isotonic | Same water potential as the organelles, which prevents net osmosis across organelle membranes, avoiding swelling/bursting or shrinkage |
| Buffered | Maintains pH, protecting protein structure and enzyme activity from pH changes |
Cold slows reactions rather than permanently denaturing every enzyme. Isotonic conditions prevent net water movement, not all water-molecule movement (see 3.2.3).
Watch out
It is organelles that must remain intact after homogenisation. The cells have deliberately been broken open, so "stops cells bursting" is not the reason.
Separate by differential centrifugation
Centrifugation makes components sediment: the tube is spun so fast that a strong force drives them towards its base. Spinning at very high speed is ultracentrifugation, and using a series of increasing speeds to separate components is differential centrifugation. The deposit is the pellet; liquid above it is the supernatant.
At a given spin time, larger and denser components generally sediment at lower speeds; smaller components need higher speeds or longer spins. Size, density and shape all affect sedimentation, so "the heaviest always comes first" is an oversimplification.
For an animal-tissue fraction rich in mitochondria:
- Centrifuge filtered homogenate at low speed. Nuclei and large debris pellet, so retain the supernatant.
- Transfer the supernatant to another tube and spin at a higher speed. Collect the resulting mitochondria-rich pellet.
- Further higher-speed spins can sediment membrane fragments and eventually very small components such as ribosomes.
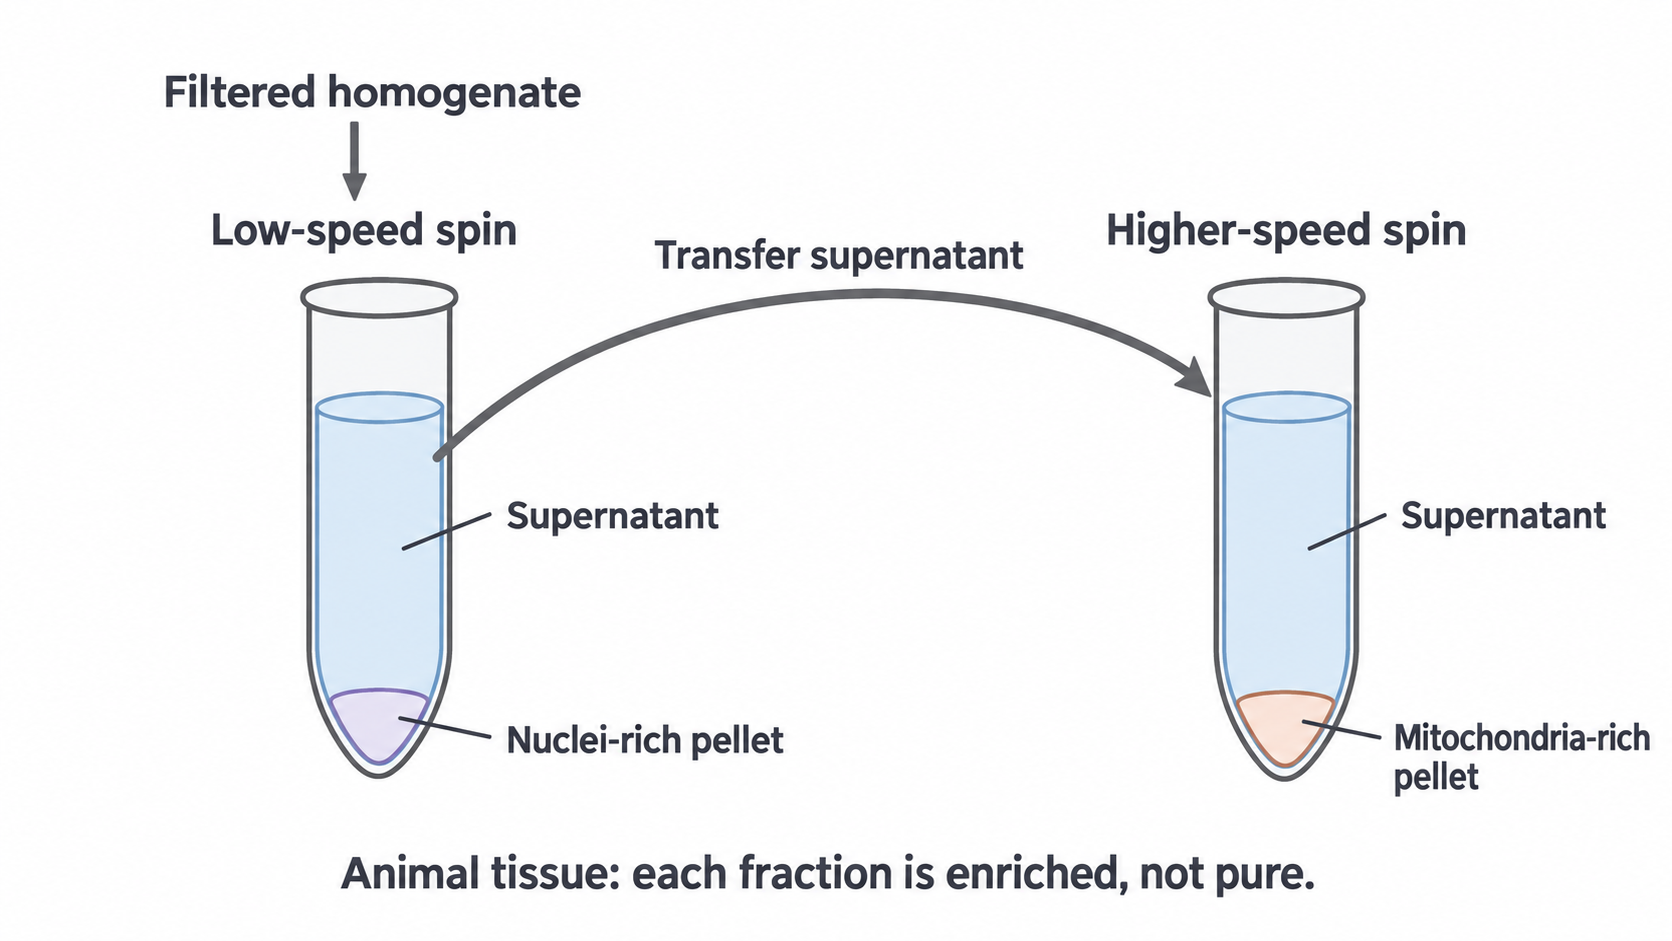
If nuclei are the target, collect the first pellet instead. Plant homogenates may also yield a chloroplast-rich fraction before a mitochondria-rich fraction.
Fractions are enriched, not automatically pure: organelles with overlapping sedimentation properties may pellet together, including mitochondria and lysosomes. Verify a fraction using microscopy or a suitable marker of organelle activity.
A full answer gives the protective solution, filtering and what you keep after each spin.
Recording cells and choosing a method
Record only what you can really see, then pick the method that can actually answer your question.
Observing and drawing cells
In supervised practical work, a thin potato-tissue preparation can be treated with iodine in potassium iodide solution: starch-containing grains turn blue-black. Start at low power to locate the specimen, then use high power for detail.
The colour reaction identifies starch; it does not identify every organelle or show that the cell is alive.
A scientific drawing records observed structures, not a remembered ideal cell.
- Content: draw only visible detail, in accurate relative proportions.
- Lines: use a sharp pencil and large, clear, continuous outlines. Avoid shading and repeated sketch lines.
- Labels: use straight ruled lines that meet the structure and do not cross.
- Annotations: distinguish an observation from an inference.
- Title and scale: identify the specimen or view, record the objective or total magnification, and add a measured scale bar when calibrated size is known.
For your practical notebook, draw and annotate a cell actually observed, then check your drawing against the specimen for invented features.
Matching the method to the question
First identify whether the question is about a living process, internal structure, surface structure or biochemical activity; then test each method against that need.
| Investigation | Method | Why |
|---|---|---|
| Changes in shape of living coloured cells | Optical microscope | Cells can remain alive and colour can be observed |
| Cristae in a thin section through a mitochondrion | TEM | Electrons pass through the section, showing internal ultrastructure |
| Surface shape of isolated mitochondria | SEM | Surface detail at sufficient resolution |
| An enzyme in mitochondria | Fractionation and a biochemical assay | An image alone cannot measure activity |
Better resolution does not settle the choice: an SEM resolves more than an optical microscope, but it would not show living cells or their colour. For the enzyme, consider contamination when interpreting activity in a mitochondria-rich fraction.
To justify a choice, link each reason to what the investigation needs.