3.1.4.2 - Enzymes
Life runs on reactions far too slow without enzymes. This lesson shows how the active site speeds them up, what changes the rate, and how enzymes shape organisms.
Enzymes as catalysts
In neutral water, half the molecules of one precursor of RNA and DNA would take about 78 million years to react.
At its enzyme's active site, that takes 18 milliseconds.
Enzymes are biological catalysts: they increase reaction rate without being used up overall.
Activation energy
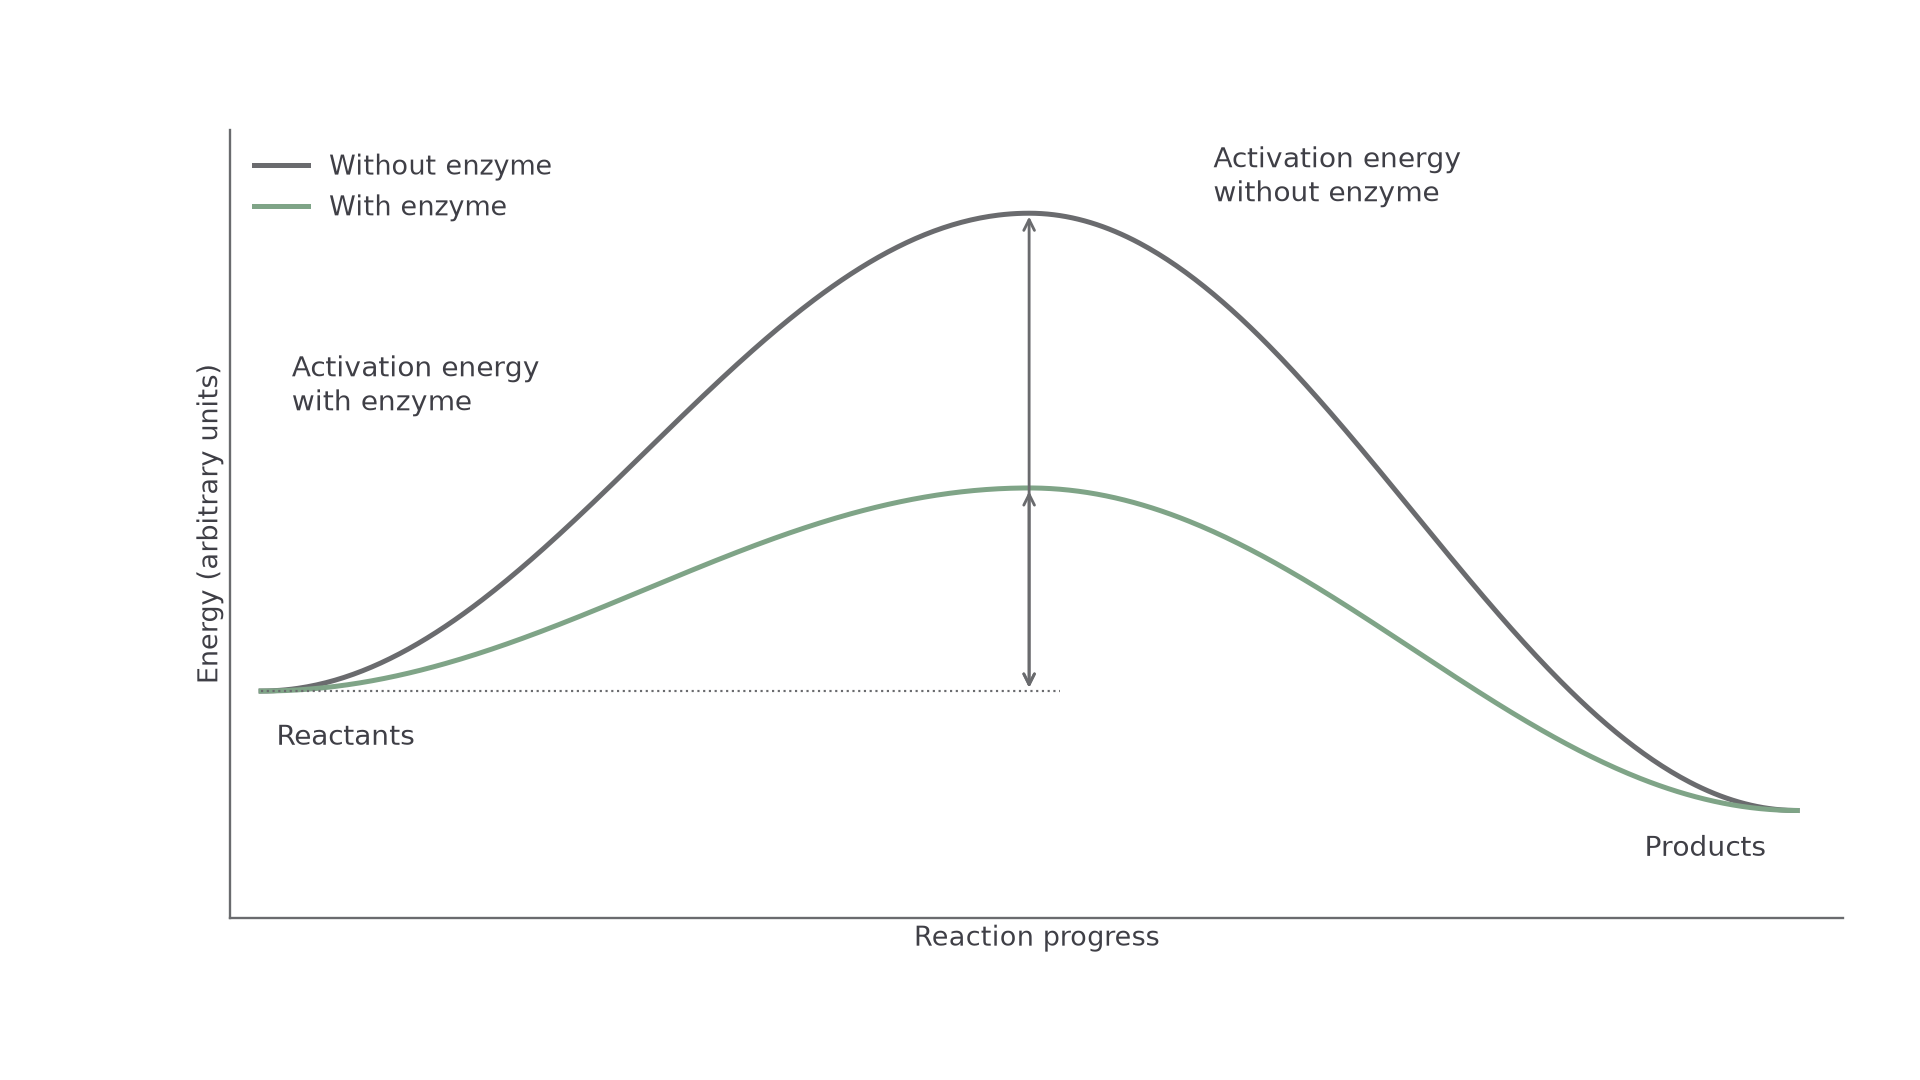
Reactants must overcome an energy barrier, the activation energy. Each enzyme lowers the activation energy of the reaction it catalyses, so at the same temperature more molecules have enough energy to react and the rate increases.
In the diagram, the enzyme path has the lower peak. Both curves start and finish at the same levels: an enzyme neither supplies energy nor changes the overall energy difference.
[DIAGRAM: asset_name: enzyme-activation-energy; asset_slug: enzyme-activation-energy; recommended_method: local_png; caption: The catalysed pathway has a lower activation-energy barrier. Both pathways start and finish at the same energy levels, the horizontal axis represents reaction progress, not time.; description: The catalysed pathway has a lower activation-energy barrier. Both pathways start and finish at the same energy levels; the horizontal axis represents reaction progress, not time.]
Active site and specificity
Most enzymes are globular proteins. Folding brings particular amino acid side chains together to form the active site, the region where the substrate binds. Its three-dimensional shape and chemical properties depend on the enzyme's tertiary structure.
A substrate, the molecule the enzyme acts on, binds temporarily, making an enzyme–substrate complex. The reaction occurs, products leave, and the enzyme is available again.
The active site and substrate are complementary, not identical: their surfaces fit together. Only a complementary substrate binds effectively, which explains specificity: an enzyme catalyses one reaction or a narrow range of related reactions.
Models of enzyme action
In 1894 Emil Fischer pictured enzyme and substrate as a lock and key.
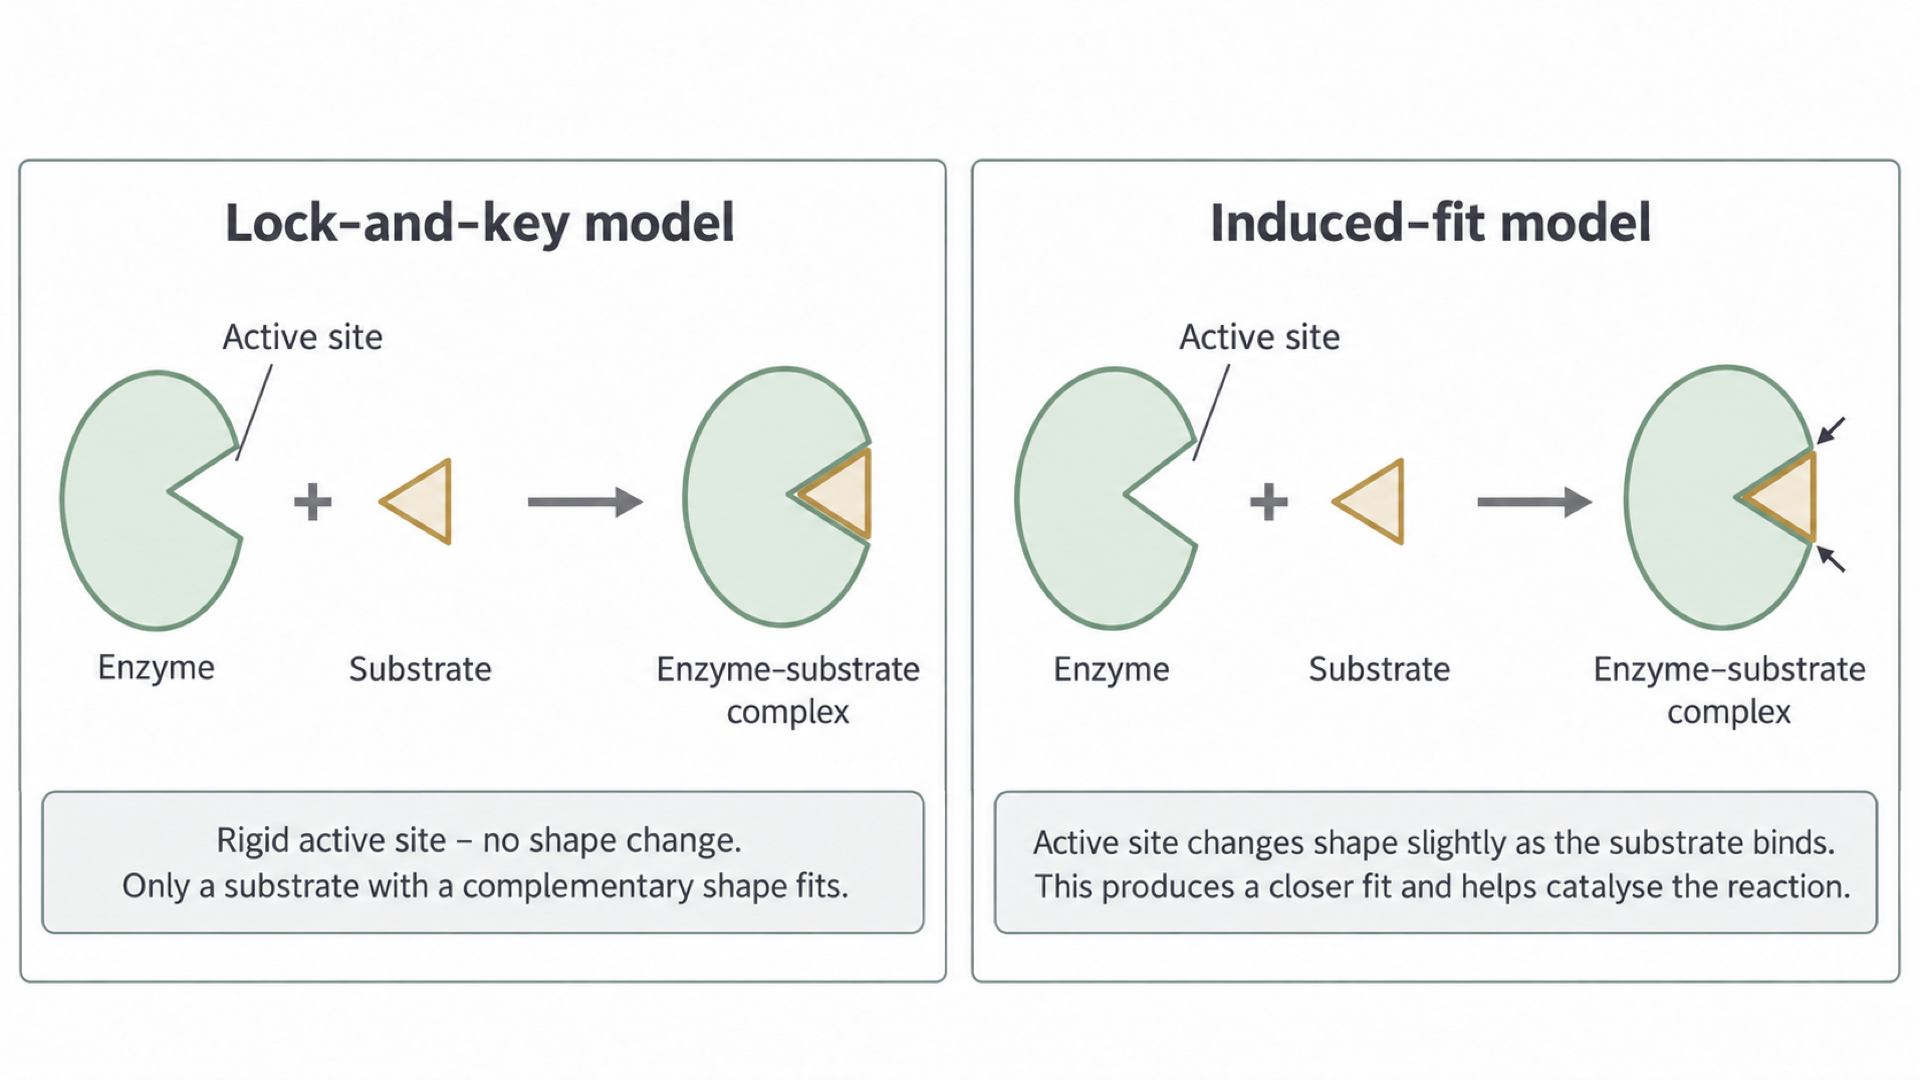
The lock-and-key model treats the active site as rigid and already complementary. That explains specificity, but not the shape changes later observed during binding.
In 1958 Daniel Koshland proposed the induced-fit model:
- A suitable substrate enters an active site that is not yet a perfect fit, and initial interactions form.
- These interactions induce a small change in the enzyme's conformation (its shape), so the active site fits more closely around the substrate.
- The closer fit positions reacting groups and can strain substrate bonds, lowering the activation energy.
- Products leave, and the enzyme can return to its unbound shape.
In the diagram, the arrows on the induced-fit panel mark the enzyme closing around the substrate.
[DIAGRAM: asset_name: 1.4.2 - Many proteins are enzymes - Diagram 2; asset_slug: 1.4.2 - Many proteins are enzymes - Diagram 2; recommended_method: local_png; caption: Rigid lock-and-key binding and binding-induced conformational change in the induced-fit model. The outlines are schematic.; description: Rigid lock-and-key binding and binding-induced conformational change in the induced-fit model. The outlines are schematic.]
Watch out
Induced fit is not denaturation: the change is small and reversible. Nor can any substrate force a fit: the initial interactions are selective.
X-ray structures of the enzyme hexokinase later showed this directly: glucose binding closes its two lobes around the substrate. Models are explanations tested against observations, so evidence like this changed the accepted model.
Temperature and pH
Temperature changes both how often molecules collide and whether the active site keeps its shape.
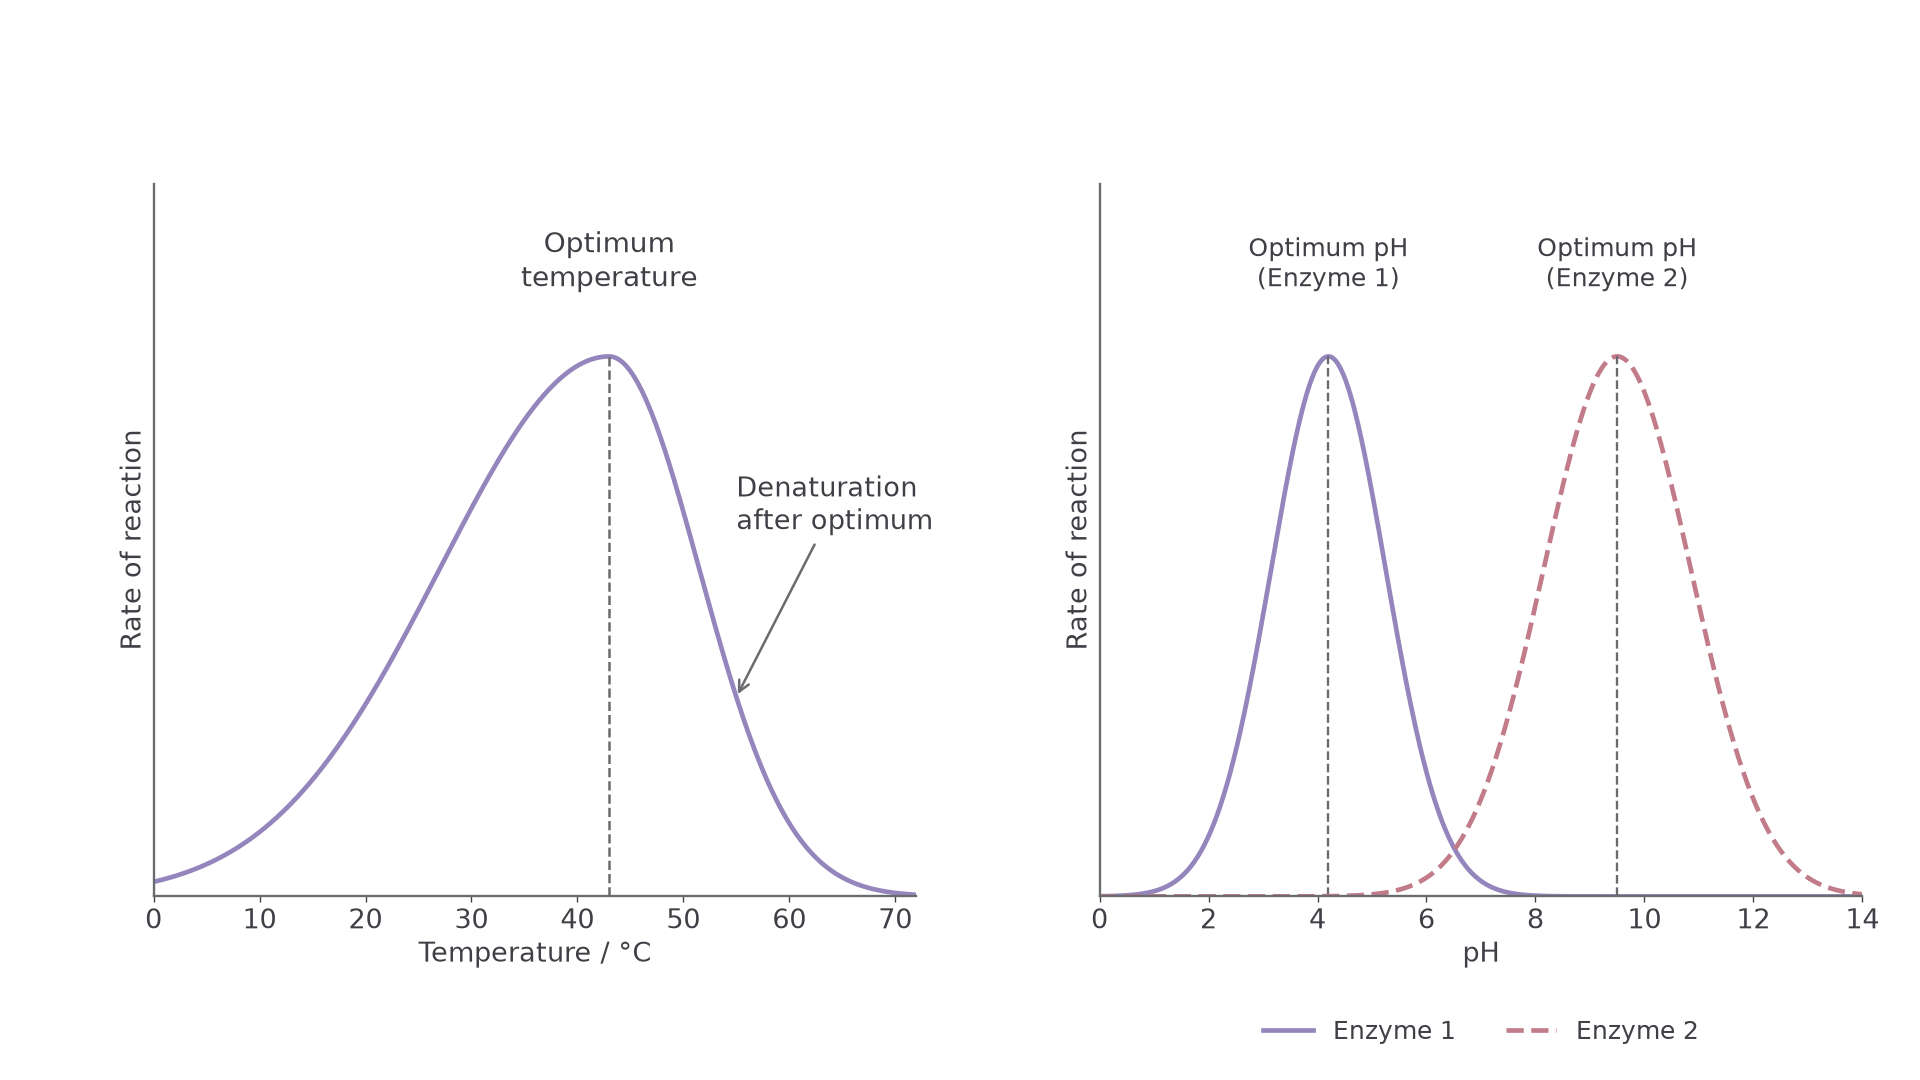
The left graph shows temperature; the right shows pH.
[DIAGRAM: asset_name: 1.4.2 - Many proteins are enzymes - Diagram 3; asset_slug: 1.4.2 - Many proteins are enzymes - Diagram 3; recommended_method: local_png; caption: Illustrative rate curves show a temperature optimum and different pH optima. The pH curves represent unnamed enzymes, not pepsin and trypsin, the vertical scale is qualitative.; description: Illustrative rate curves show a temperature optimum and different pH optima. The pH curves represent unnamed enzymes, not pepsin and trypsin; the vertical scale is qualitative.]
Why temperature gives an optimum
Low temperature gives enzyme and substrate less kinetic energy, so successful collisions and enzyme–substrate complex formation are less frequent. Warming increases these events per second, so the curve rises. Cooling slows activity reversibly; it does not normally denature the enzyme.
As temperature rises, stronger vibration increasingly breaks hydrogen bonds and ionic bonds that maintain tertiary structure. The active site changes shape, so the substrate is no longer complementary and the enzyme is denatured. Peptide bonds usually stay intact.
At the peak, the optimum temperature, this loss starts to outweigh faster collisions. It varies with the enzyme and with the duration and conditions of measurement.
Watch out
Don’t write that high temperature “kills” an enzyme: enzymes are molecules, not living things. Write “denatured” and say what happens to the active site.
How pH changes the active site
pH reflects hydrogen ion concentration: the lower the pH, the higher the concentration. Changes in alter charges on amino acid side chains and can disrupt ionic and hydrogen bonds, so the active site's shape or binding changes and the rate falls. Extreme changes can denature the enzyme.
Each enzyme has a characteristic optimum pH, as the right graph shows. Stomach pepsin works in acid; many intestinal enzymes work nearer neutral or alkaline conditions. A buffer limits pH change during an investigation.
Enzyme and substrate concentration
Rate is set by whichever is in short supply: active sites or substrate.
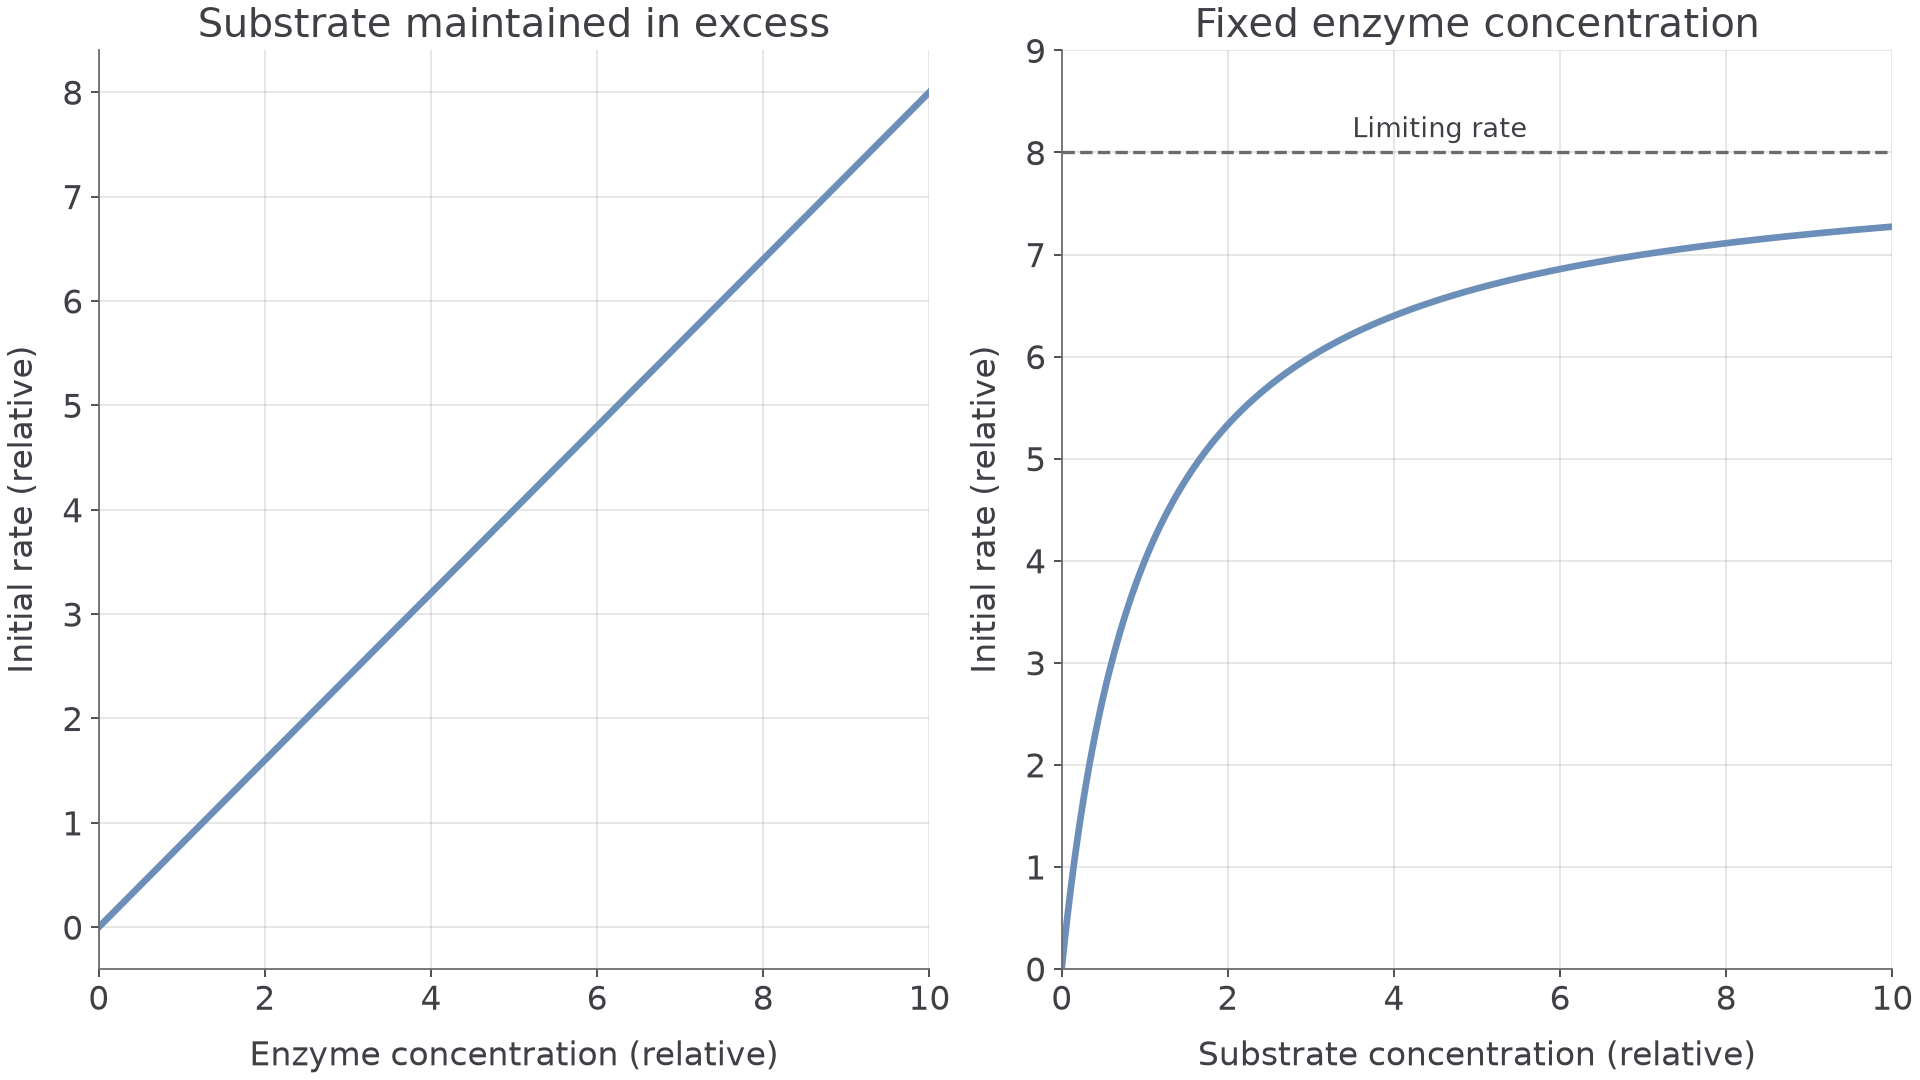
Compare initial rates, before appreciable substrate is consumed, with temperature, pH and the other concentration controlled. The left graph varies enzyme; the right varies substrate.
[DIAGRAM: asset_name: enzyme-concentration-curves; asset_slug: enzyme-concentration-curves; recommended_method: local_png; caption: Left: initial rate is proportional to enzyme concentration with substrate maintained in excess. Right: fixed enzyme concentration gives a saturating response to increasing substrate concentration. Both are illustrative, not experimental data.; description: Left: initial rate is proportional to enzyme concentration with substrate maintained in excess. Right: fixed enzyme concentration gives a saturating response to increasing substrate concentration. Both are illustrative, not experimental data.]
Enzyme concentration
With substrate in excess, active sites are in short supply. Doubling enzyme concentration doubles the active sites, so twice as many enzyme–substrate complexes are processed per second: initial rate is proportional to enzyme concentration.
If such a line levels off, substrate is no longer in excess: it runs out so quickly that substrate concentration now limits the rate.
Substrate concentration
At fixed enzyme concentration, low substrate concentration is the limit. Adding more raises collision frequency with active sites, so initial rate increases.
At high substrate concentrations the enzymes approach saturation: active sites are occupied most of the time and their turnover, how fast they process substrate and release product, limits the rate. Extra substrate then makes little difference, so the curve levels off towards a maximum rate, the limiting rate on the graph.
Watch out
A plateau here means a limited number of working enzyme molecules, not that the enzyme is used up or all the substrate has reacted.
More enzyme can raise this maximum rate, provided substrate remains available, but its specificity does not change.
Enzyme inhibition
An inhibitor lowers the rate of an enzyme-controlled reaction.
Where it binds decides whether extra substrate can overcome it.
Competitive inhibitors
A competitive inhibitor is similar enough in shape or chemical features to bind at the active site, so it competes with the substrate. At a fixed substrate concentration, more inhibitor occupies more active sites, so fewer enzyme–substrate complexes form per second.
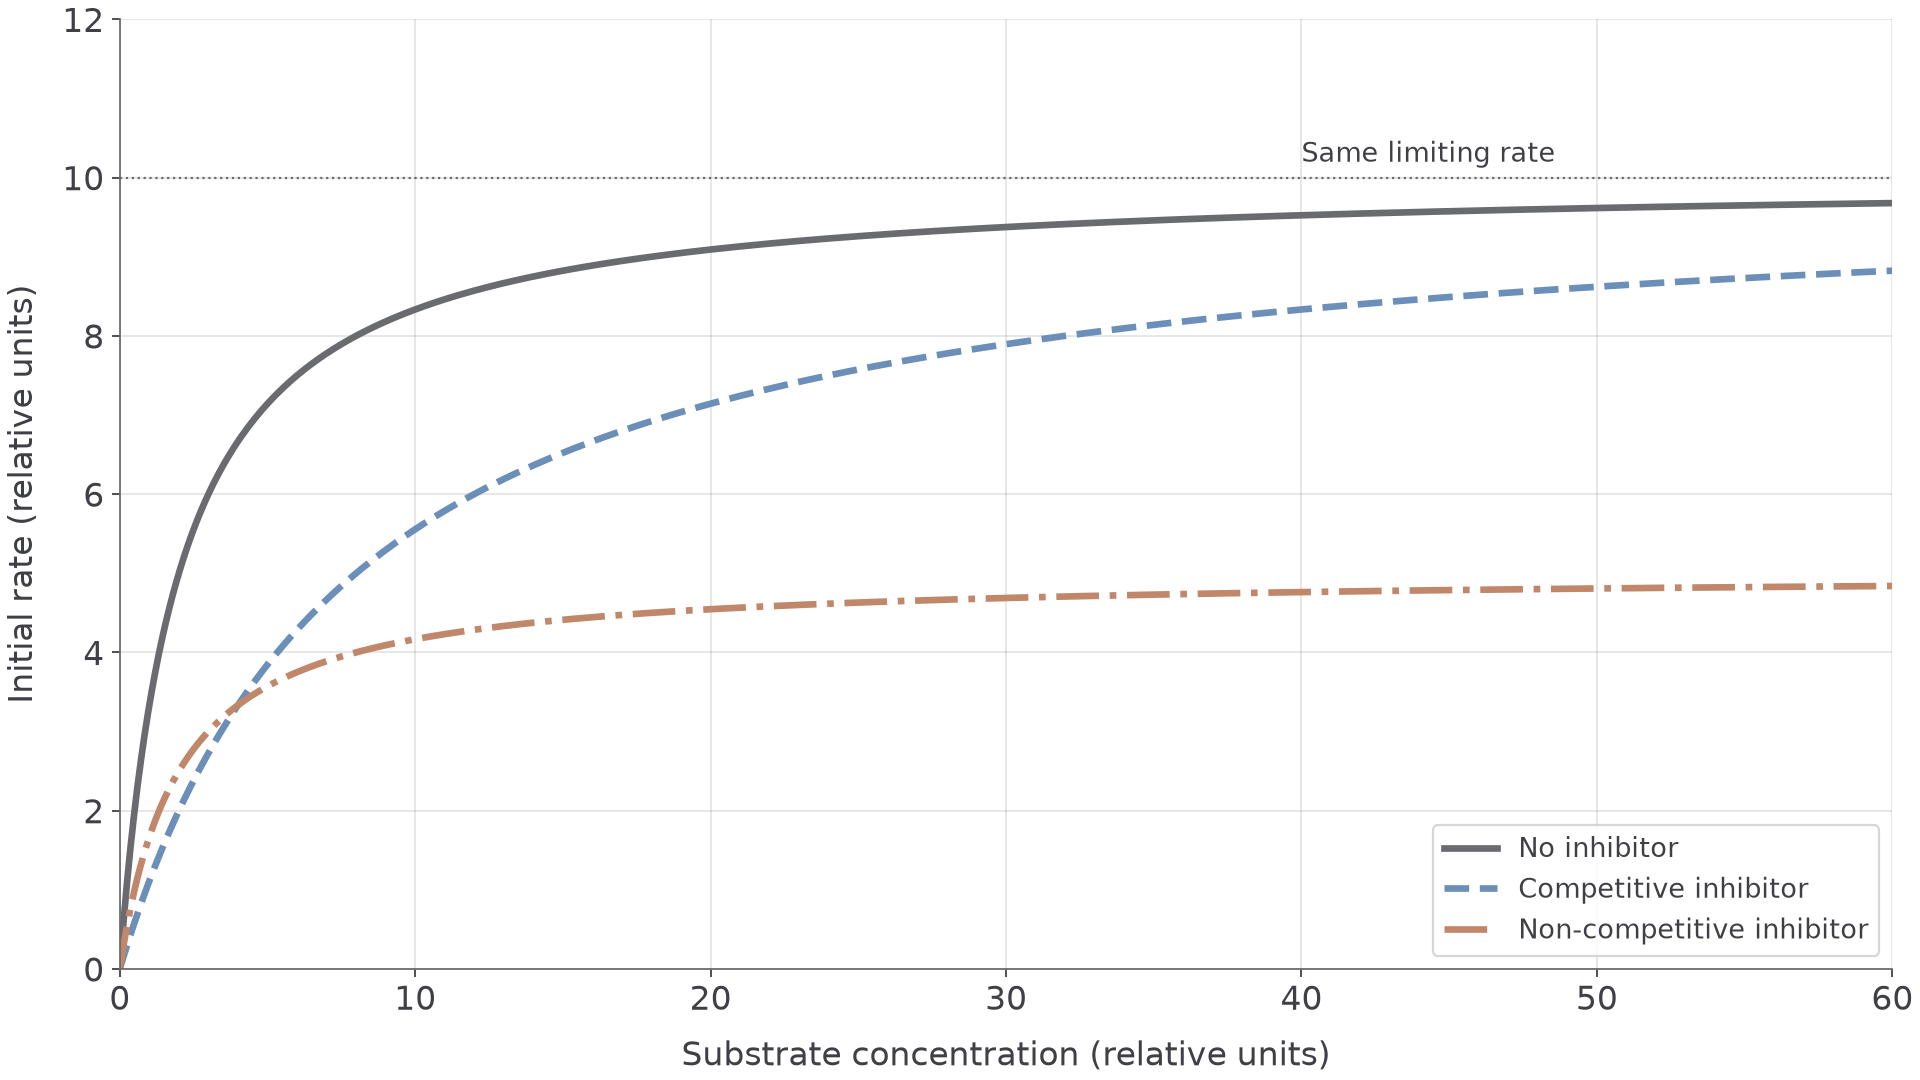
More substrate reduces the effect, because substrate is then more likely to occupy an active site. The inhibitor binds only temporarily, so in this reversible model the same maximum rate can be approached at a high enough substrate concentration.
Non-competitive inhibitors
A non-competitive inhibitor binds at another site and alters the enzyme's conformation. In the simple model the active site no longer functions normally, although the inhibitor need not block it.
More inhibitor means fewer working enzymes. Extra substrate cannot displace it from its different site, so the original maximum rate cannot be restored.
On the graph, compare the three curves at high substrate concentration: the competitive curve keeps climbing towards the same limiting rate, while the non-competitive curve levels off lower.
[DIAGRAM: asset_name: enzyme-inhibitor-curves; asset_slug: enzyme-inhibitor-curves; recommended_method: local_png; caption: Illustrative reversible inhibition: a competitive inhibitor shifts the curve right but retains the same limiting rate, a simple non-competitive inhibitor lowers the limiting rate. Compare all curves at the same substrate concentration.; description: Illustrative reversible inhibition: a competitive inhibitor shifts the curve right but retains the same limiting rate; a simple non-competitive inhibitor lowers the limiting rate. Compare all curves at the same substrate concentration.]
| Competitive inhibitor | Non-competitive inhibitor | |
|---|---|---|
| Binds at | The active site | Another site |
| More inhibitor | More active sites occupied | Fewer working enzymes |
| More substrate | Reduces the inhibition | Cannot displace the inhibitor |
| Maximum rate | Same rate can be approached | Original rate not restored |
Cover the table, then explain the difference from memory.
Enzymes in living systems
Why does a Siamese cat have dark ears, face, paws and tail? One enzyme explains it.
Specificity means different reactions need different enzymes, so cells can run many reactions at once. In a metabolic pathway, one reaction's product becomes the next reaction's substrate, with a different enzyme at each step, so regulating an early enzyme can affect the supply of later products.
Intracellular enzymes act inside cells:
- Respiration enzymes catalyse reactions that release energy from organic molecules, supporting ATP production.
- DNA polymerase catalyses DNA synthesis, so genetic information can be copied.
- Other enzymes make the phospholipids of cell membranes, so they help determine cell structure.
Extracellular enzymes are made in cells and secreted to act outside them. Digestive proteases hydrolyse proteins in the gut lumen, which is outside the body cells, and the smaller products can be absorbed and used for growth and repair.
From enzyme to organism
Siamese cats carry a variant of tyrosinase, the enzyme that drives production of the dark pigment melanin. The variant loses activity in warmer regions such as the torso, so full colour appears only in the cooler ears, face, paws and tail.
Changing one enzyme can therefore alter a pathway and then an organism's structures, or its supply of nutrients or energy.