RP01 - Rate of an enzyme-controlled reaction
Trypsin turns cloudy milk clear, and a stopwatch turns that change into a rate. Plan required practical 1, calculate rates from raw times and graphs, and judge your results.
Measuring rate with trypsin and milk
Cloudy milk clears as a protease digests it, so you can time an enzyme-controlled reaction by eye.
Required practical 1 investigates the effect of a named variable on the rate of an enzyme-controlled reaction: temperature, pH, enzyme concentration or substrate concentration. There is no compulsory recipe, but any design must measure a change in rate and control other factors.
One workable system is trypsin, a protease, hydrolysing casein in a milk suspension:
- Casein scatters light, so the suspension looks cloudy.
- Hydrolysis produces smaller soluble products, so cloudiness decreases.
- You time how long the tube takes to reach a defined clearing endpoint.
That time is a rate proxy, a measurement standing in for rate. It works only when every tube has the same starting composition and the same endpoint.
For temperature, predict a rising rate as warming increases successful enzyme–substrate collisions, then a fall if denaturation reduces the number of functional active sites. This is a hypothesis to test, so never change or discard results to match a textbook curve.
Choose a range and intervals after a pilot: reactions should be slow enough to time but fast enough to observe. If a tube has not cleared when observation ends, record “not reached within 600 s”, for example, rather than inventing a time or writing zero seconds.
Timing the clearing reaction
A repeatable procedure fixes both the reaction start and its endpoint.
These quantities are an example plan, to check in a pilot and against your school’s risk assessment.
- Label tubes for each temperature and independent repeat. Put of consistent milk suspension in one tube, and of trypsin solution with of pH 7 buffer in another, so the reaction cannot start early. Use the same stock concentrations throughout.
- Stand both tubes in a thermostatically controlled water bath at the chosen temperature and let them equilibrate. Both must reach this temperature first: if one starts cooler or warmer, the mixture starts somewhere in between. Check the actual temperature, because the bath setting may not be exact.
- Keep this enzyme pre-incubation time constant, because long exposure to high temperature can reduce enzyme activity before mixing.
- Add the enzyme mixture to the milk and start the stopwatch at mixing. Mix in a standardised way: bung the tube, invert it gently the same number of times to avoid froth, and return it promptly to the bath.
- Watch a standard black cross through the suspension, keeping tube diameter, light and viewing direction the same. Stop timing when the cross first becomes clearly visible. This is an operational endpoint, not proof that every peptide bond has been hydrolysed.
- Use fresh mixtures for at least three independent repeats at each temperature, across a range such as 20,30,40,50,60 °C. Record every reading immediately.
Measure small volumes with graduated pipettes or syringes, because a wide-range measuring cylinder may have too coarse a scale. Alternate the order of temperatures or prepare fresh enzyme in small batches, so enzyme deterioration over time is not mistaken for a temperature effect.
Variables, controls and safety
A temperature result means little unless everything else stays controlled.
The independent variable is actual reaction temperature.
The directly measured dependent variable is clearing time, from which you calculate a relative rate. Keep other influences constant, each for a stated biological reason.
| Variable to control | Practical action | Why it matters |
|---|---|---|
| pH | Same buffer concentration, pH and volume | pH affects active-site function |
| Enzyme concentration | Same stock and measured volume | Determines available active sites |
| Substrate concentration | Mix the same milk stock before measuring equal volumes | Changes collision frequency and the amount to digest |
| Total volume and optical path | Same volumes and tube diameter | Alters dilution and visibility of the endpoint |
| Mixing and temperature exposure | Same gentle mixing and equilibration procedure | Affects reaction start and enzyme activity |
The negative control
A controlled variable is held constant across experimental tubes; a control treatment is a separate comparison. A negative control replaces trypsin solution with the same volume of water, or with boiled trypsin, keeping the milk, buffer and other conditions.
If it stays cloudy while the enzyme mixture clears, the comparison supports a role for trypsin. If both clear, consider settling or another change.
Hazards and precautions
Assess hazards before work, using your school’s risk assessment:
- Trypsin can irritate tissues or cause sensitisation: use prepared solutions, avoid aerosols and skin contact, wear eye protection and wash off splashes.
- Hot water can scald: use a stable bath, tube holders where needed and safe temperatures.
- Glassware can break: handle it carefully and report breakage.
Interpreting the temperature response
A shorter time to the same endpoint indicates a faster reaction.
In illustrative data, times of 189 s, 79 s and 271 s at 25, 40 and 60 °C show that the fastest of the tested conditions is 40 °C.
Exam tip
Examiners report students reading a longer time as a faster reaction. State “shortest time, so fastest rate” before you explain.
From 25 to 40 °C, greater kinetic energy increases successful collisions, so more enzyme–substrate complexes form per second. At 60 °C, a second effect takes over:
- Heat breaks hydrogen and ionic bonds holding the tertiary structure.
- The active site changes shape, so casein is no longer complementary to it.
- Fewer enzyme–substrate complexes form, and this outweighs the extra collisions.
Watch out
Warming does not lower activation energy. The enzyme does that, and warming gives more molecules enough kinetic energy to reach it. The enzyme is denatured, not “killed”, because it is a molecule, not a living thing.
Rate data alone do not reveal the enzyme’s structure directly. Report the slower rate as the measured pattern, and denaturation as a plausible explanation of it.
These three temperatures do not locate the exact optimum, which could lie between them. Test more closely spaced temperatures around the apparent peak, with repeats. A conclusion should quote the relevant values, state the range tested and acknowledge variation.
From raw times to a rate graph
A column of stopwatch times becomes a rate only through careful recording.
Keep a raw-data table with temperature in the first column, separate repeat times, and observations such as frothing. Record to the resolution of the instrument: calculator digits do not increase measurement precision.
| Temp / °C | Time 1 / s | Time 2 / s | Time 3 / s |
|---|---|---|---|
| 30 | 118 | 122 | 120 |
Process those times in a second table:
| Temp / °C | Mean time / s | Rate / s⁻¹ |
|---|---|---|
| 30 | 120 | 0.00833 |
Exam tip
Put units in column headings only, never beside each number. AQA has rejected mixed units such as “/ minutes and seconds”, so convert before calculating a mean: 2 min 15 s is 135 s, not 2.15 min.
Rate is change divided by time. Every tube reaches the same endpoint, so the change is the same and only the time differs. Rate is therefore the reciprocal of time:
Relative rate
A tube that clears in 100 s is reacting twice as fast as one that takes 200 s: against . This is a relative rate, not a molar rate, because the amount of casein digested has not been measured in moles.
Worked example: relative rate from repeat times
Plan: find the mean of the repeats in the table, then take its reciprocal.
- Mean: .
- Reciprocal: .
Answer: to three significant figures, because the raw times have three: a calculated result can only be reported to the limits of the least accurate measurement.
Check: a time near 100 s implies a reciprocal near . A result near 100 would be inverted.
Keep possible anomalies in the raw record. Exclude a value only with a defensible, documented reason, such as a known spill or severe frothing affecting the endpoint, and repeat the condition where feasible. An inconvenient high or low value is not automatically an anomaly.
Plot temperature on the horizontal axis and relative rate on the vertical axis, with clear units and sensible scales. Draw a line graph rather than a bar chart: temperature is a continuous independent variable, so the values between your tested temperatures have meaning. A bar chart suits separate categories, such as two different enzymes.
Do not force a curve through every point or extrapolate an exact optimum beyond the data. If you show error bars, state what they represent.
Improving the method
The best improvements fix a weakness you have actually identified.
More repeats reduce the influence of random variation on a mean, but they do not correct a systematically miscalibrated thermometer. A thermostatic water bath reduces temperature drift, but it does not remove subjective endpoint judgement.
Using a colorimeter
A colorimeter replaces that judgement with a number: it measures light attenuation by the cloudy suspension, so its absorbance reading falls as the milk clears.
Select settings by a pilot, use a suitable blank, and keep cuvette type, orientation, volume and wavelength constant. Wipe the outside and remove bubbles. Record readings at regular times, ideally using a data logger, with a temperature-controlled holder so measuring does not change the reaction temperature.
Treat absorbance as a proxy unless calibrated against concentration. A fixed-time reading can compare tubes, but it is not itself an instantaneous rate.
Exam tip
Light must pass through the sample, so a solid piece of tissue cannot simply go in a colorimeter. In a 2024 AQA question, almost as many students chose that as chose the right answer: comparing the surface colour with a standard colour chart.
Where a reaction shows no clear change of its own, a qualitative reagent can follow it. For amylase acting on starch, transfer samples to iodine at regular intervals and time how long the blue-black colour takes to stop appearing.
Changing the named variable
Each named variable needs its own adjustment to the method:
| Named variable | How to vary it | Also keep constant |
|---|---|---|
| pH | Use a suitable range of buffer pH values, checking the actual mixture pH where feasible | Temperature and composition |
| Enzyme concentration | Dilute stock enzyme with water, but use the same added volume | Substrate and buffer composition |
| Substrate concentration | Vary the substrate stock dilution | Enzyme concentration and total volume |
More enzyme raises the rate by supplying more active sites. It does not change the enzyme’s specificity.
Substrate concentration needs a different measurement. Different milk concentrations start at different cloudiness and contain different amounts of substrate, so the same visible endpoint may not represent the same amount of reaction. Use a calibrated change or an initial colorimeter slope, and account for different starting readings.
Rates from straight lines and tangents
A graph of amount of product against time shows progress.
Its gradient gives rate; its final height gives amount, not rate. On a straight section, use two well-separated points on the fitted line:
Rate from a gradient
For a line from to , rate is . Use the differences, not simply final product divided by final time, unless the line passes through the origin.
Curves and tangents
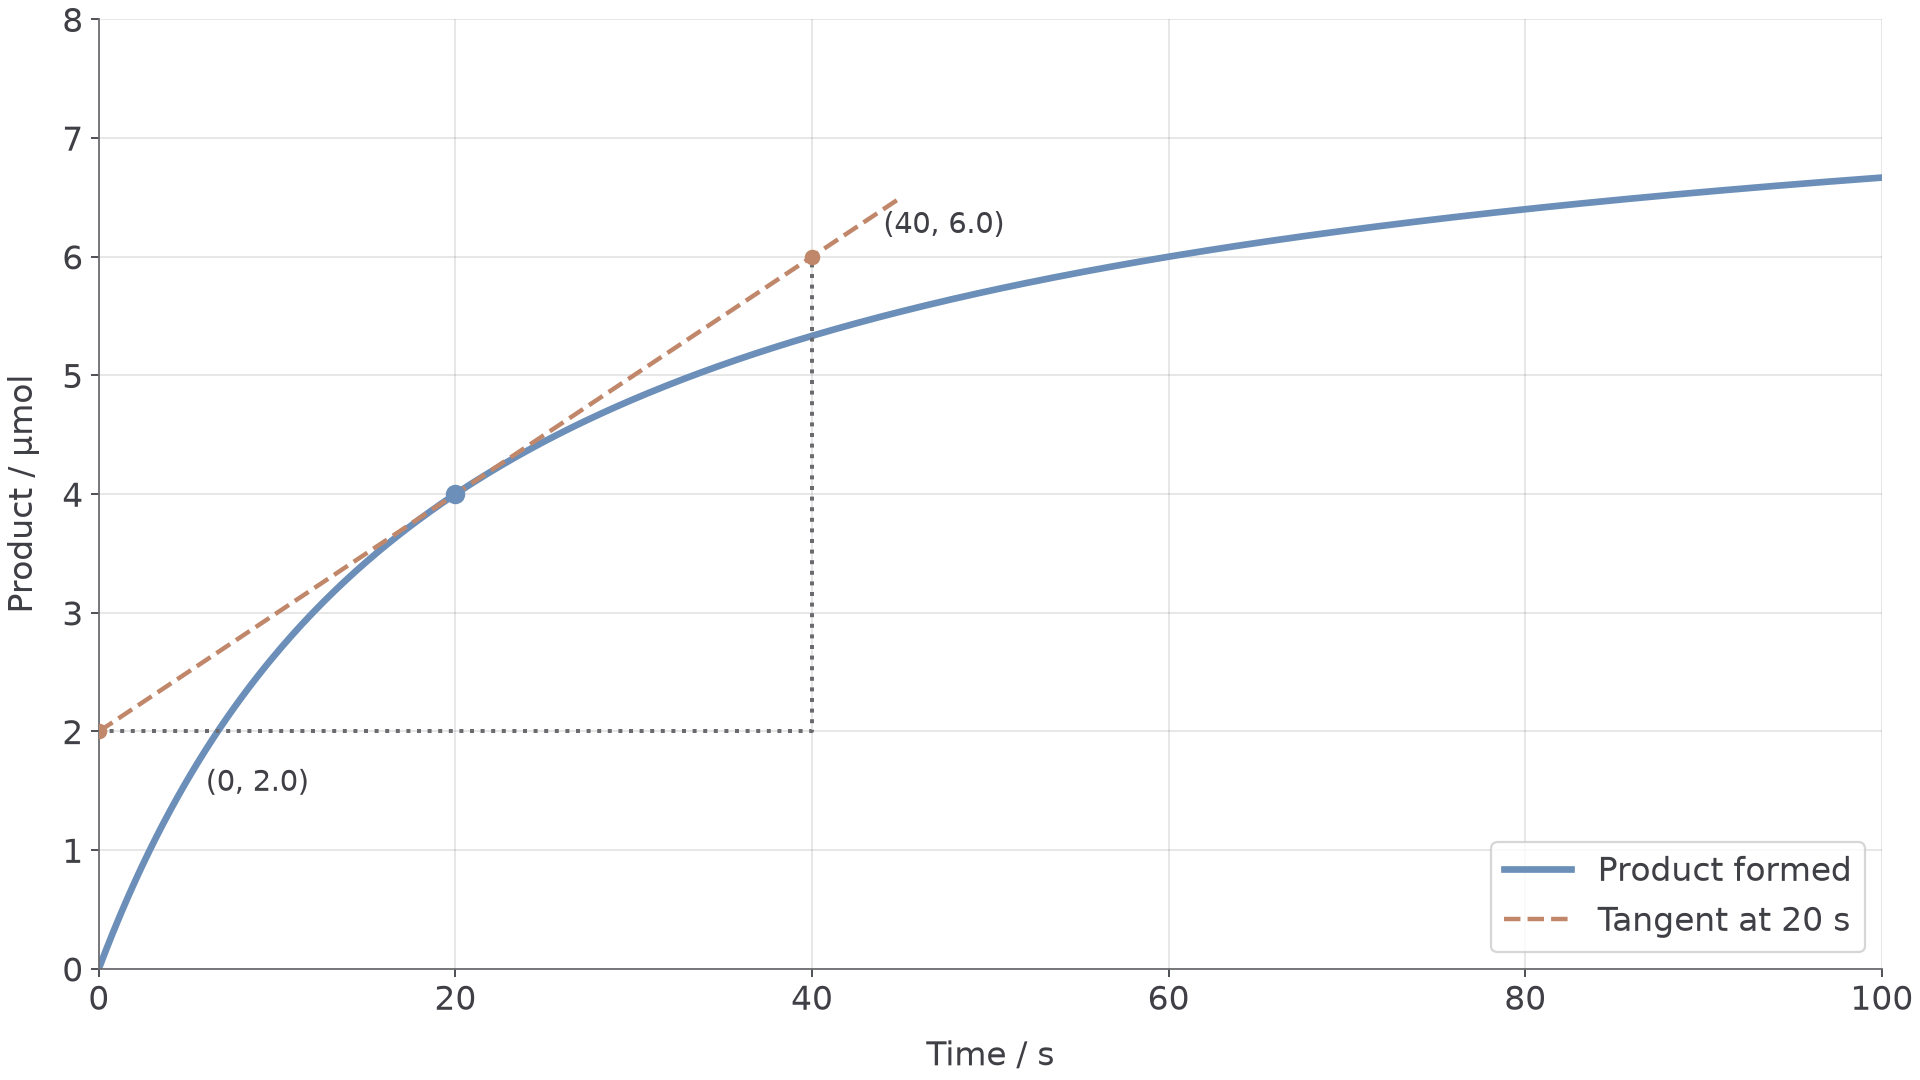
On a curve, rate changes with time. Draw a tangent that matches the curve’s direction at the requested instant, extend it, and choose two widely separated points on it. Those points need not be experimental data points.
A chord joining two points on the curve gives an average rate over that interval, not the instantaneous rate at one point. In the graph, follow the dashed tangent at 20 s and read the two marked points on it.
[DIAGRAM: asset_name: reaction-progress-tangent; asset_slug: reaction-progress-tangent; recommended_method: local_png; caption: Illustrative product-time curve and tangent at 20 s. The marked points lie on the tangent, not on the reaction curve. Use their vertical and horizontal differences.; description: Illustrative product-time curve and tangent at 20 s. The marked points lie on the tangent, not on the reaction curve. Use their vertical and horizontal differences.]
Worked example: rate at 20 s from a tangent
Plan: divide the differences between two far-apart points on the tangent.
- Points: and .
- Gradient: .
Answer: .
Check: the curve’s average gradients over the 20 s either side are about 0.2 and 0.07, which bracket 0.100.
The later, shallower gradient is consistent with substrate depletion: as substrate is used up, enzyme and substrate collide less often, so fewer enzyme–substrate complexes form per second. It does not by itself show that enzyme has been destroyed.
For the initial rate, draw the tangent at time zero. Compare initial rates between conditions: at that moment every tube has its full substrate concentration, whereas later a faster tube has used up more.
If that tangent passes through and , its gradient is .
For falling absorbance against time, the gradient is negative. Report it with its sign, or report the positive magnitude of the decrease, in absorbance units per second.
Uncertainty and combined measurements
Even a finely graduated stopwatch can give uncertain clearing times.
The cause is human: a person judges the reaction start and endpoint.
- Accuracy is closeness to a true or accepted value.
- Precision is the spread of repeated measurements.
- Resolution is the smallest instrument increment.
For a simple school estimate, assign an analogue reading half the smallest division, or use the value supplied in a question. An interval found by subtracting two readings carries both uncertainties, so add them to estimate the largest possible uncertainty. Then convert to a percentage, which AQA papers also call percentage error:
Percentage uncertainty
A length on a ruler is also an interval, because you read both ends.
Exam tip
With 1 mm graduations each end is ±0.5 mm, so a 4 mm length is ±1 mm, a 25% error. On a 2024 AQA paper, the common answer of ±0.5 mm and 12.5% lost the uncertainty mark.
Combining uncertainties
These rules give simple maximum estimates, not statistical confidence intervals.
- For addition or subtraction, add absolute uncertainties, not percentages. A burette delivery from two readings each uncertain by has uncertainty .
- For multiplication or division, add percentage uncertainties. If a measured product amount has 3% uncertainty and the time has 2%, their quotient has approximately 5% uncertainty.
So has approximately the same percentage uncertainty as .
Worked example: uncertainty in a rate
Plan: combine the two time readings, convert to a percentage, then carry it to the rate.
- Start and finish are each , so an interval of 50.0 s is , not .
- Percentage uncertainty: .
- Rate: , also about 2.0% uncertain.
Answer: , with approximate uncertainty .
Check: and , the same spread.
Repeat spread is different from instrumental uncertainty. The range describes observed variation, including endpoint inconsistency, and is not automatically a standard deviation. Short intervals usually have a greater percentage timing uncertainty, so a slower measurable reaction can improve relative precision.
Writing up the investigation
A useful record lets someone understand what was done, check the calculations and judge the conclusion.
Before starting, write a focused question and justified prediction, identify the independent, dependent and controlled variables, and select a feasible range, repeats and equipment with suitable resolution. Plan how to monitor a difficult control such as temperature drift, rather than pretending it can be held perfectly constant.
Record date, method, stock concentrations, apparatus, actual settings, raw measurements and observations during the work. Keep original anomalous readings, document any exclusion, and note what a pilot changed and why. A clean final table must not replace the contemporaneous record.
Spreadsheets and the final report
A spreadsheet can preserve raw times, calculate means and reciprocals, and plot labelled graphs. If repeat times occupy B2:D2, a mean formula can refer to that range and a rate formula to the mean cell. Check one row manually, and confirm that an excluded value is not still in a formula range.
Save the original and processed files so the calculation can be traced. With a data logger, inspect sampling intervals and sensor limits rather than accepting software output uncritically.
A short report presents the question, reproducible method and risk controls, raw and processed results, a conclusion supported by values, and an evaluation linking each important uncertainty to a specific improvement. Distinguish source data from measurements you actually collected.
Cite sources by author or organisation, title, year or version, and a retrievable link. For example: AQA, AS and A-level Biology 7401/7402 specification, version 1.6, July 2026, sections 3.1.4.2 and 8.3–8.4.
Written answers and this lesson do not demonstrate a practical endorsement pass. The teacher needs evidence of each student’s actual performance and contemporaneous records across the required competencies: following procedures, using apparatus, controlling variables, working safely, recording observations, and researching and reporting.