6.4 - Confidence intervals for a mean
A sample mean estimates one unknown number, but different random samples give different estimates. In this part of 6.4, you will turn that sampling variation into a confidence interval, interpret its confidence level, and calculate how confidence, population spread and sample size affect precision.
The confidence procedure
Does a confidence interval contain of the individual measurements? No: it estimates the population mean. Its width comes from the variation of sample means, which is smaller than the variation of individual observations.
Suppose a normal population has known standard deviation , and an independent sample of size is taken. The sample mean has standard error . The standard normal tables give approximately
Before sampling, therefore, there is probability that the random sample mean lies within standard errors of the fixed population mean. The same inequality can be read in reverse:
After observing , use its value for the interval's centre.
Confidence interval
A confidence interval is an interval calculated from sample data by a stated procedure. A confidence procedure produces intervals containing the fixed population parameter in of repeated random samples in the long run, under the model.
For an observed interval, say “we are confident that the population mean lies between these limits”.
[DIAGRAM: asset_name: Repeated samples and confidence intervals; asset_slug: mean-confidence-procedure; caption: The population mean stays fixed while the sample interval changes; description: Five horizontal confidence intervals from different possible samples are plotted against one fixed vertical population-mean line. Four intervals cross the line and one misses it. Each interval is centred on its own sample mean. A note says that the realised proportion covering the mean in a small collection need not equal the confidence level.]
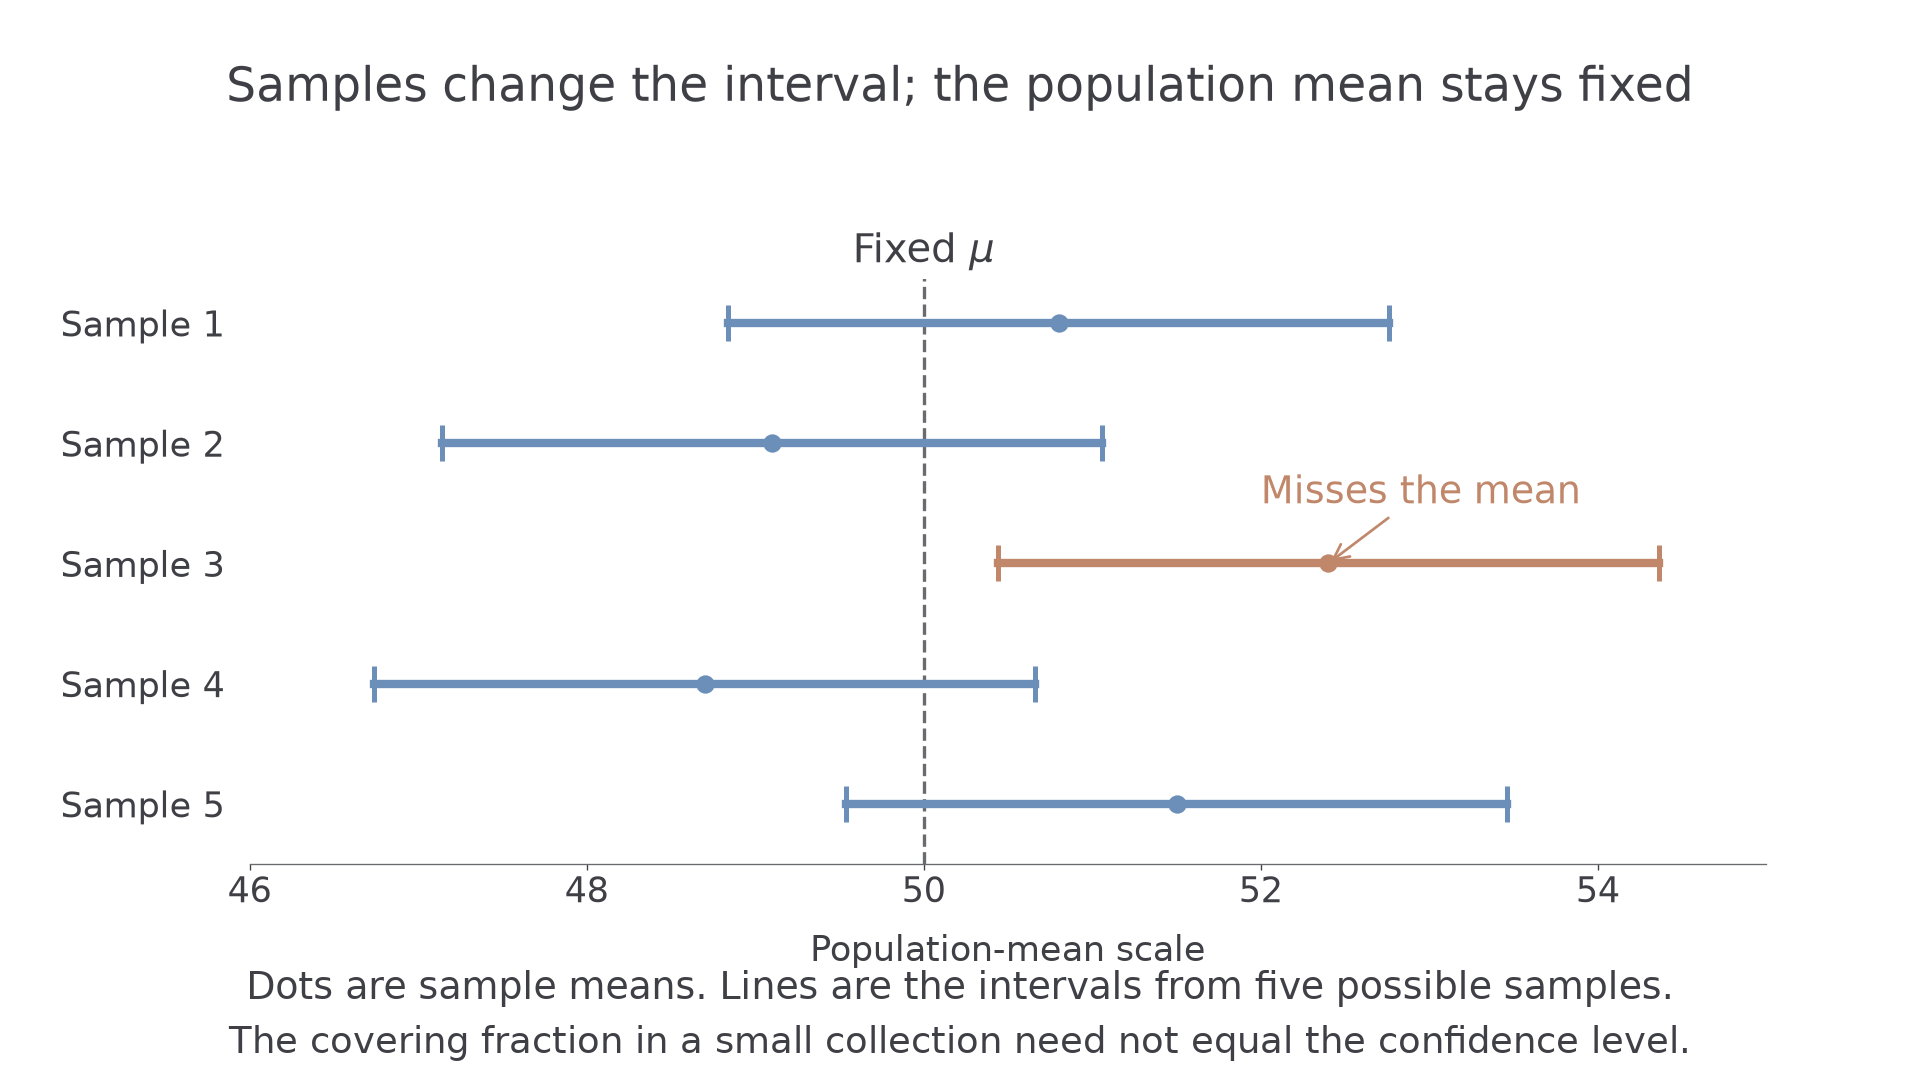
The confidence level describes the procedure's long-run coverage, not a guaranteed proportion within a small collection of intervals. Once you have calculated one interval, its endpoints and are fixed: it either contains or it does not. The repeated-sampling interpretation does not assign a new probability distribution to .
A mean interval also does not say that of future sample means lie in this particular observed interval. Its purpose is to estimate the fixed population mean from one sample. Individual-observation prediction is a different task.
Key idea
The parameter stays fixed; the random sample changes the interval. Confidence measures how reliably the procedure captures the parameter over repeated samples.
Identify the correct interpretation in context.
Known variance and normal population
For a normal population with known variance, the sample mean's normal distribution gives a confidence interval at any sample size. Choose a central normal probability equal to the requested confidence level, leaving equal areas in the two tails.
Normal confidence interval for a mean
For independent observations from a normal population with known standard deviation , a central interval for is
where . The quantity is the margin of error, or half-width.
The interval formula is not in the formula booklet: construct it using the sample-mean distribution. Common normal critical values are supplied in the tables.
For confidence, each tail is , so and . For , use ; for , use . A interval leaves in each tail, so uses , not the critical value for a left area of .
Worked example 1: a 95 percent interval
Question. Measurements are normally distributed with known standard deviation . An independent random sample of has mean . Find a confidence interval for the population mean.
Plan. Use and standard error .
Answer. The interval is , or to significant figures.
Check. The midpoint is ; the half-width is standard errors. The two omitted normal tails each have area .
Keep the sample and population spread unchanged, but increase only the confidence level. Greater long-run coverage requires a wider interval.
Worked example 2: a 99 percent interval
Question. For the same sample, find a confidence interval for the population mean.
Plan. Replace the critical value by , retaining the same standard error.
Answer. , or to significant figures.
Check. The midpoint is unchanged. Its half-width is larger than , and its two tails each have area , giving greater coverage than before.
Continue this lesson.
You’re previewing NovaLearn without an account. Create a free account to read the rest.
Create free account