5.5 - Finding normal cut-offs and parameters
Sometimes the area under a normal curve is known and the measurement is missing. Work backwards from a probability to a standardised value, find cut-offs, and use one or two probability statements to determine an unknown mean or standard deviation.
From probability to a z-value
Measurements have mean and standard deviation . Where does the highest begin? The boundary is above the mean, but its distance is determined by area, not by taking of the mean.
The supplied table gives . To work backwards, convert the requested event into a left-tail probability first. Then find that probability in the body of the table and read the corresponding . The critical-values table supplies common results such as
For a lower-tail area below , use symmetry: a left area has . A small right tail, by contrast, gives a positive .
Returning from a z-value to a measurement
For , a boundary corresponding to standardised value satisfies
Not in the formula booklet: rearrange the standardisation relationship. Common normal critical values are supplied in the tables.
The two examples use the same model and equal tail areas on opposite sides.
Worked example 1: an upper cut-off
Question. . Find such that .
Plan. Convert to a left area of , look up , then return to the measurement scale.
Answer. , to significant figures.
Check. The unrounded boundary gives , whose right area is about . The cut-off is above the mean, as an upper boundary should be.
Change only which tail has area . The distance from the mean stays the same, but its sign changes.
Worked example 2: a lower cut-off
Question. For , find such that .
Plan. Reflect the positive critical value, then use .
Answer. .
Check. The unrounded values obey , confirming that the two equal-area tails are reflections about .
[DIAGRAM: asset_name: Equal tails and inverse cut-offs; asset_slug: normal-inverse-cutoffs; caption: Equal ten-percent tails have cut-offs equally far below and above the mean; description: A normal curve with mean 100 and standard deviation 12 has a shaded left tail of area 0.10 ending at 84.616 and a shaded right tail of area 0.10 starting at 115.384. The centre is labelled 100 and the corresponding z values minus 1.282 and 1.282 appear beneath the boundaries.]
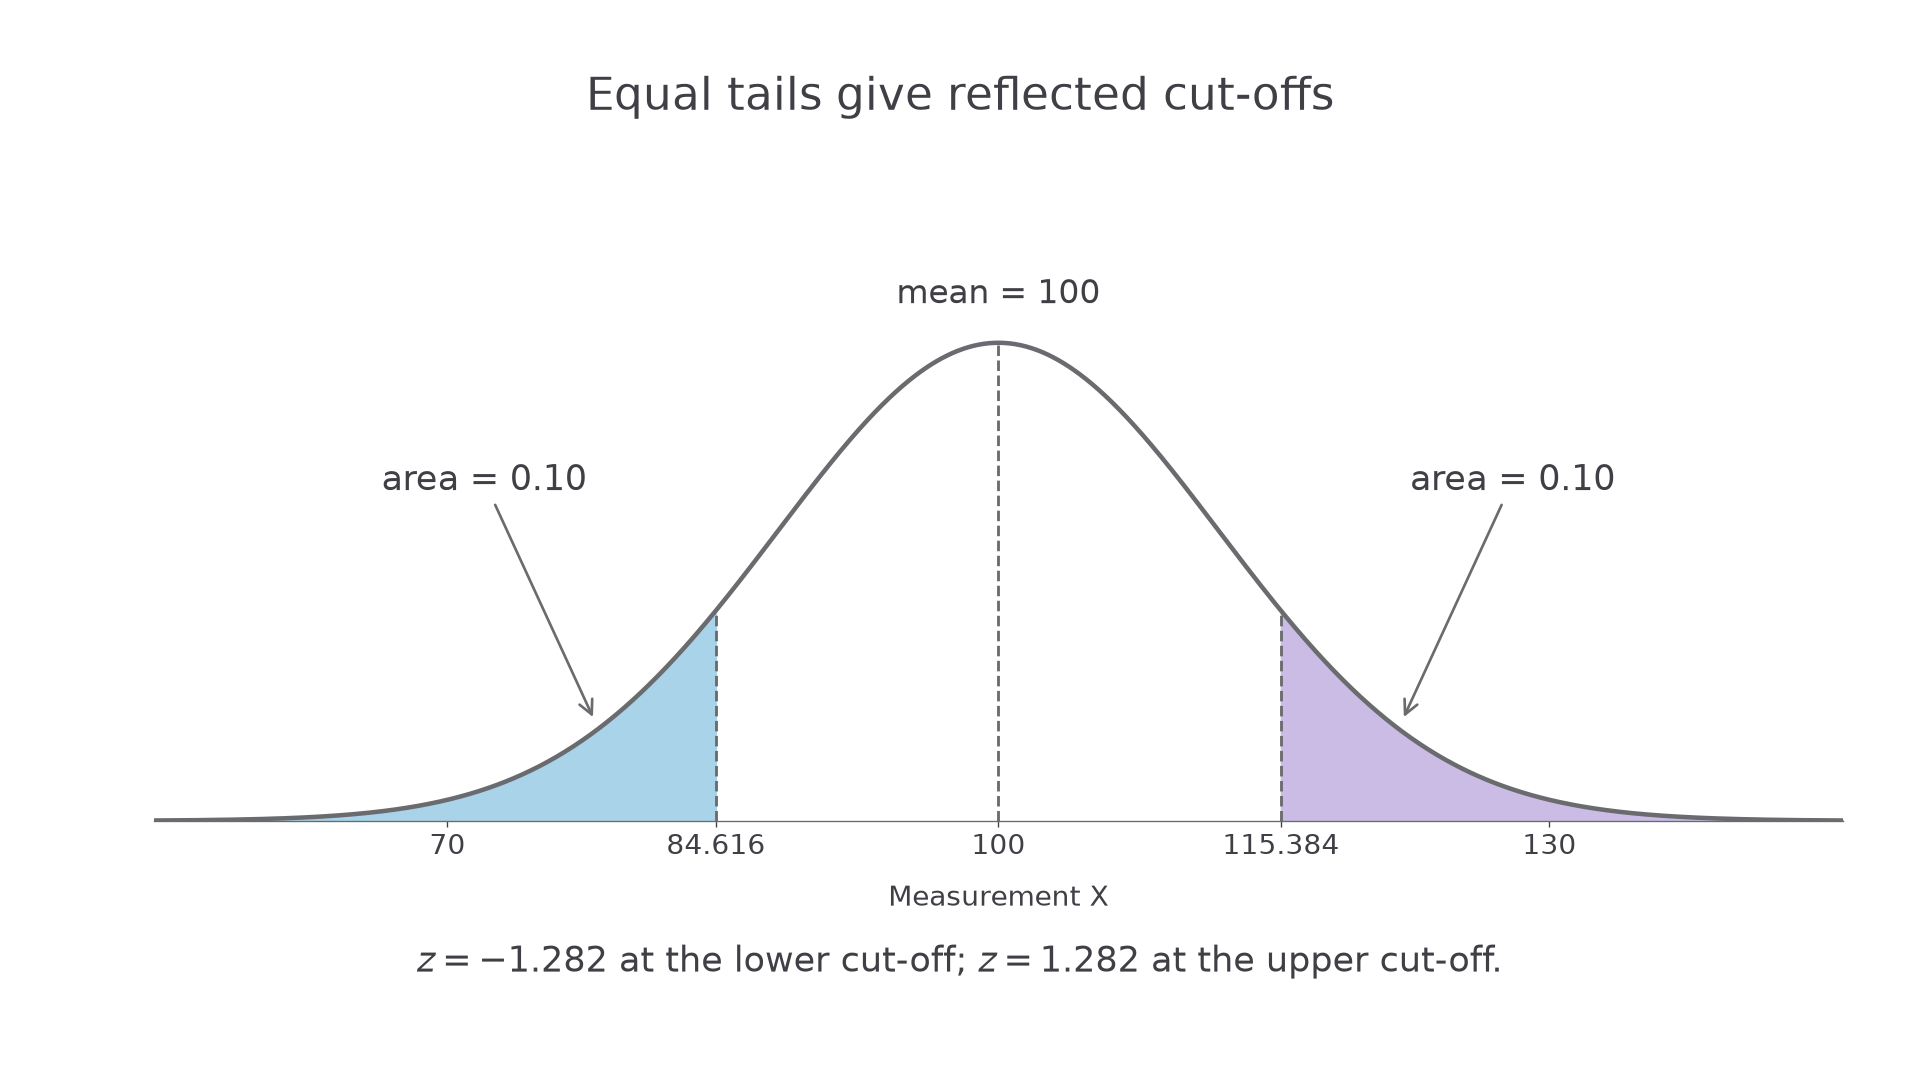
For a probability absent from the critical-values table, search the main table. For example, a left area lies between and , so is between and , approximately by interpolation. Retain enough precision until the final answer.
Watch out
A right-tail probability of does not mean , and it does not mean . Shade the requested tail, convert to a left area, then look up .
Find a different upper percentile in this check.
Finding an unknown mean or spread
A probability statement locates a boundary in standard-deviation units even when the original normal parameters are unknown. Translate that statement to , then solve for the missing parameter. The standard deviation must be positive.
Worked example 3: finding a mean
Question. is normally distributed with unknown mean and standard deviation . Given , find .
Plan. A left area of corresponds to ; substitute the known cut-off and spread.
Answer. .
Check. The unrounded mean gives . The boundary is above the mean, consistent with of observations lying below it.
Keep the cut-off and probability, but now make the mean known and the spread unknown. The table lookup is unchanged; the algebra changes.
Continue this lesson.
You’re previewing NovaLearn without an account. Create a free account to read the rest.
Create free account