1.5 - Sine, cosine and tangent graphs
A moving point on a circle produces a repeating wave when you record one coordinate against its angle. In this part of 1.5, you will sketch sine, cosine and tangent, then change their sizes, periods and positions. You will also work backwards from a graph's features to an equation and use intersections to read solutions.
Period and symmetry
As a radius turns round the unit circle, its vertical coordinate traces sine and its horizontal coordinate traces cosine. Both coordinates return to their starting values after one full turn. In between, they pass through the four axis points, giving the key values needed for a sketch.
Period
A function is periodic when its values repeat after a fixed positive input change. Its period is the smallest such change. Sine and cosine have period , or radians; tangent has period , or radians.
Tangent repeats after half a turn because both circle coordinates change sign, leaving their quotient unchanged. When cosine is zero, tangent is undefined. As the angle approaches one of these values, the quotient grows without bound in magnitude, producing a vertical asymptote. A tangent sketch has separate branches; never join them through an asymptote.
| Function | Range | Features in one turn from to |
|---|---|---|
| Zeros at ; maximum at ; minimum at | ||
| Zeros at ; maxima at ; minimum at | ||
| all real values | Zeros at ; asymptotes at |
The endpoint repeats the start of the next turn. The equivalent degree values follow from .
[DIAGRAM: asset_name: Three periodic graphs; asset_slug: basic-trigonometric-graphs; caption: Sine and cosine repeat after a full turn, while tangent repeats after a half-turn and has separate branches; description: Three labelled plots on radian axes show sine, cosine and tangent from minus pi to 2pi. Sine and cosine have heights minus 1 and 1 marked. Tangent has dashed vertical asymptotes at minus pi over 2, pi over 2 and 3pi over 2, with disconnected increasing branches.]
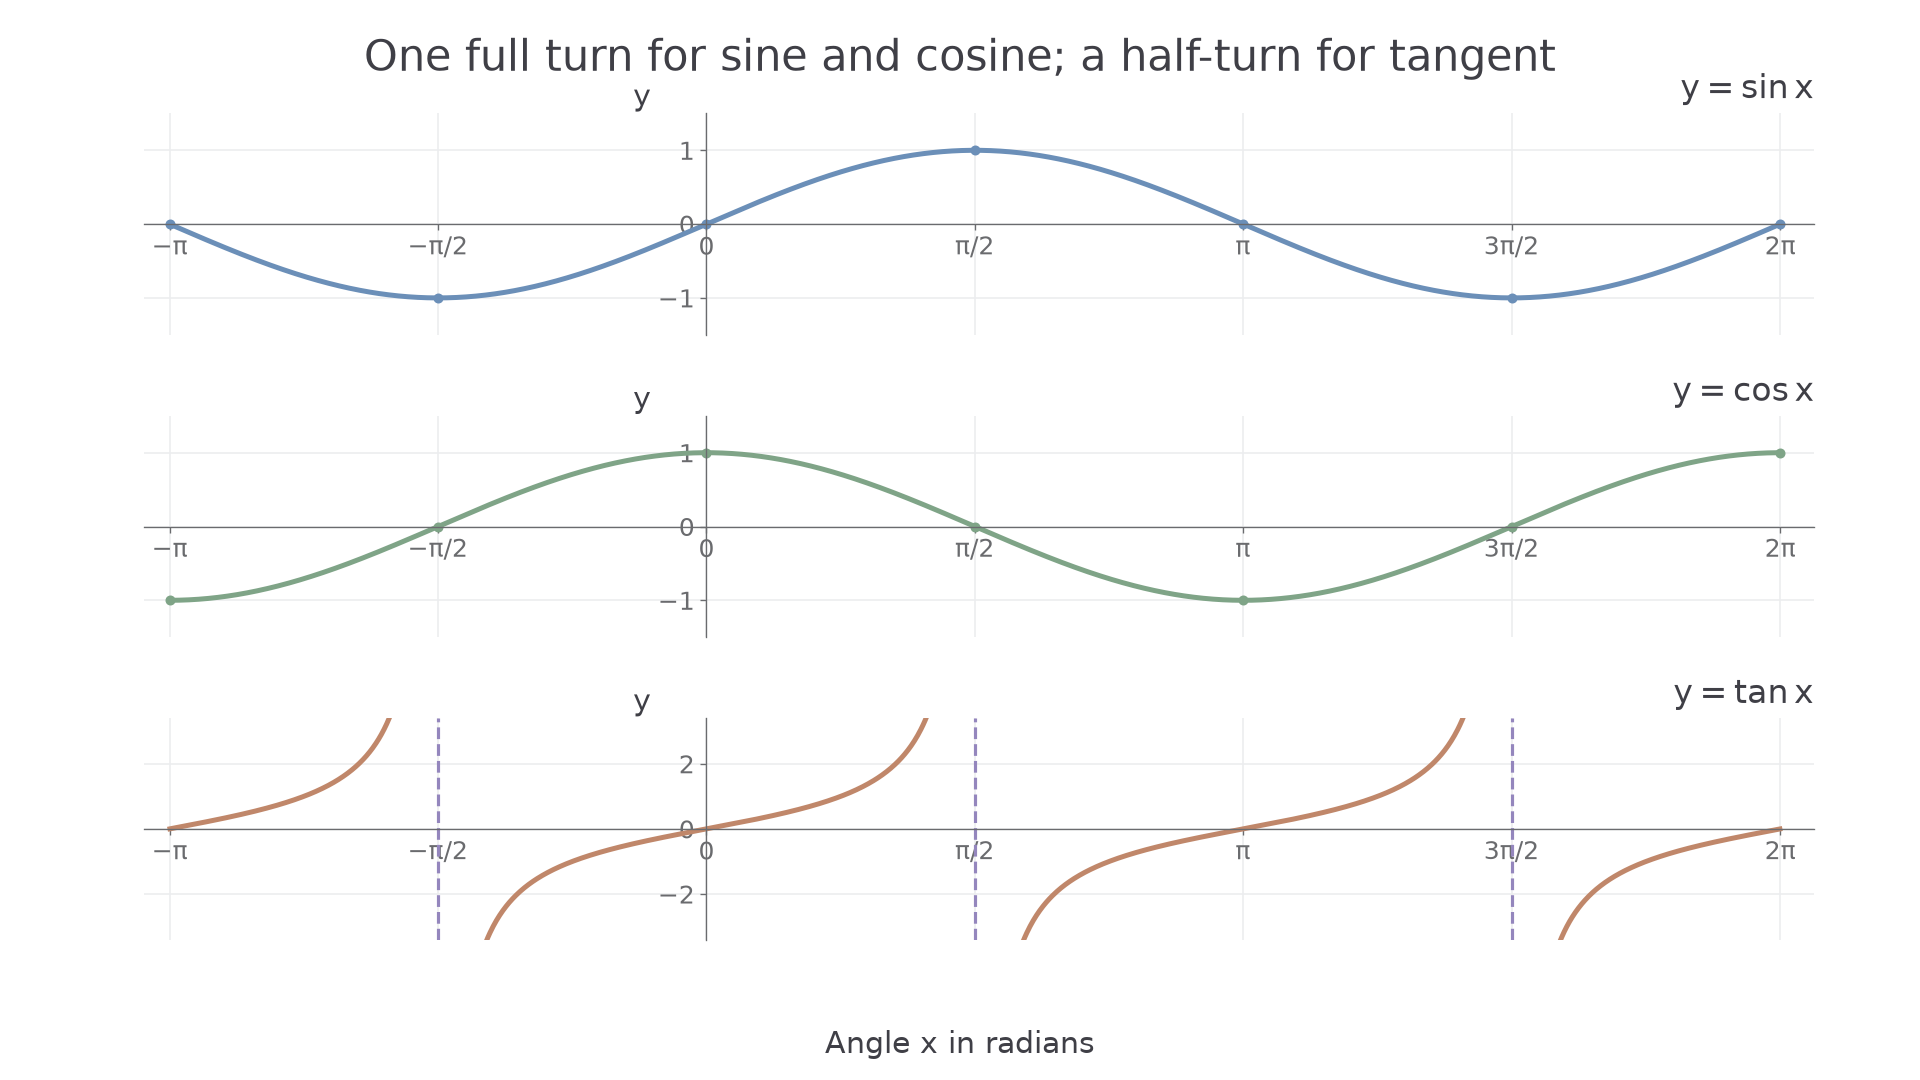
Reflection across the horizontal axis on the unit circle changes the sign of sine but not cosine. Thus , , and wherever tangent exists. Cosine's graph is symmetric about the vertical axis; sine and tangent have half-turn symmetry about the origin. These graph facts are not listed as a table in MF19.
Worked example 1: sine beside cosine
Question. Describe sketches of and for , giving their key quarter-turn points.
Plan. Read the unit-circle values at successive quarter-turns and join smoothly, preserving the symmetry.
Sine rises from its minimum at through the origin to its maximum at . Cosine has a maximum at , with matching heights to the left and right.
Answer. Smooth waves through the five points in each row, both bounded by and .
Check. The table satisfies and ; each interval spans exactly one full period.
Tangent uses the same angles, but some of those inputs are missing from its domain.
Worked example 2: tangent's disconnected branches
Question. Describe a sketch of for , giving its asymptotes, zero and the points with height or .
Plan. Locate the zeros of cosine first, then use reference values on either side.
The asymptotes are and ; the only zero in this open interval is . Useful points are
Draw each branch increasing. The central branch goes from large negative values just right of , through the origin, to large positive values just left of . The two outer pieces belong to neighbouring branches.
Answer. Three disconnected pieces, with the stated asymptotes and points. The excluded endpoints and would have height zero.
Check. The heights at and agree because their inputs differ by . Also, the points are paired by origin symmetry.
For any larger interval, repeat a basic cycle and check the requested endpoints. A sketch needs labelled zeros, extrema and asymptotes where relevant; a dense table of unlabelled points hides those features.
Changing amplitude and period
The transformations of ordinary function graphs work for trigonometric graphs too. In , first ask which input makes the inner angle reach each familiar quarter-turn. Then multiply its sine by and add . The same approach works for cosine and tangent.
Size, period and position
For , , the sine or cosine graph
has midline , amplitude , range , and period radians or .
For , the period is radians or ; it has no amplitude because its values are unbounded. These transformation rules are not listed in MF19.
Amplitude is the distance from the midline to a maximum, not the full maximum-to-minimum distance. A negative reflects the graph vertically before the shift by . The input shift is read after factoring the inner coefficient: , so it shifts right by , not . A negative adds a horizontal reflection; the period remains positive.
Worked example 3: a reflected cosine wave
Question. Find the amplitude, period and range of , with in radians. Give five key points for .
Plan. The inner angle makes a full turn as changes by . Transform the five quarter-turn cosine values.
The amplitude is , the period is , and the midline is . Thus the range is .
Answer. Amplitude , period , range , with the five points in the final row.
Check. Directly, gives , a maximum; gives , a minimum. Their mean is the midline .
Tangent's inner angle determines the positions of its asymptotes, rather than maxima and minima.
Worked example 4: a shifted tangent branch
Question. For , find the period, the two asymptotes enclosing , and the point at the middle of that branch.
Plan. Factor the inner expression. Set it to , and for the branch's left boundary, centre and right boundary.
At , the inner angle is zero and .
Answer. Period ; asymptotes and ; middle point .
Check. The asymptotes are apart, one whole tangent period. At , the inner angle is , giving , on the rising branch to the right of its centre.
The paired graphs show how the same inner-angle method locates very different features.
[DIAGRAM: asset_name: Transformed wave and tangent; asset_slug: transformed-trigonometric-graphs; caption: Quarter-turn inputs locate a cosine wave's extrema and a tangent branch's asymptotes; description: Left shows y equals 1 minus 2 cosine 2x from 0 to pi, with five key points, midline y equals 1, minimum minus 1 and maximum 3. Right shows y equals tangent of 2x minus 60 degrees plus 1 between asymptotes x equals minus 15 degrees and 75 degrees, with middle point 30 degrees comma 1 and point 52.5 degrees comma 2.]
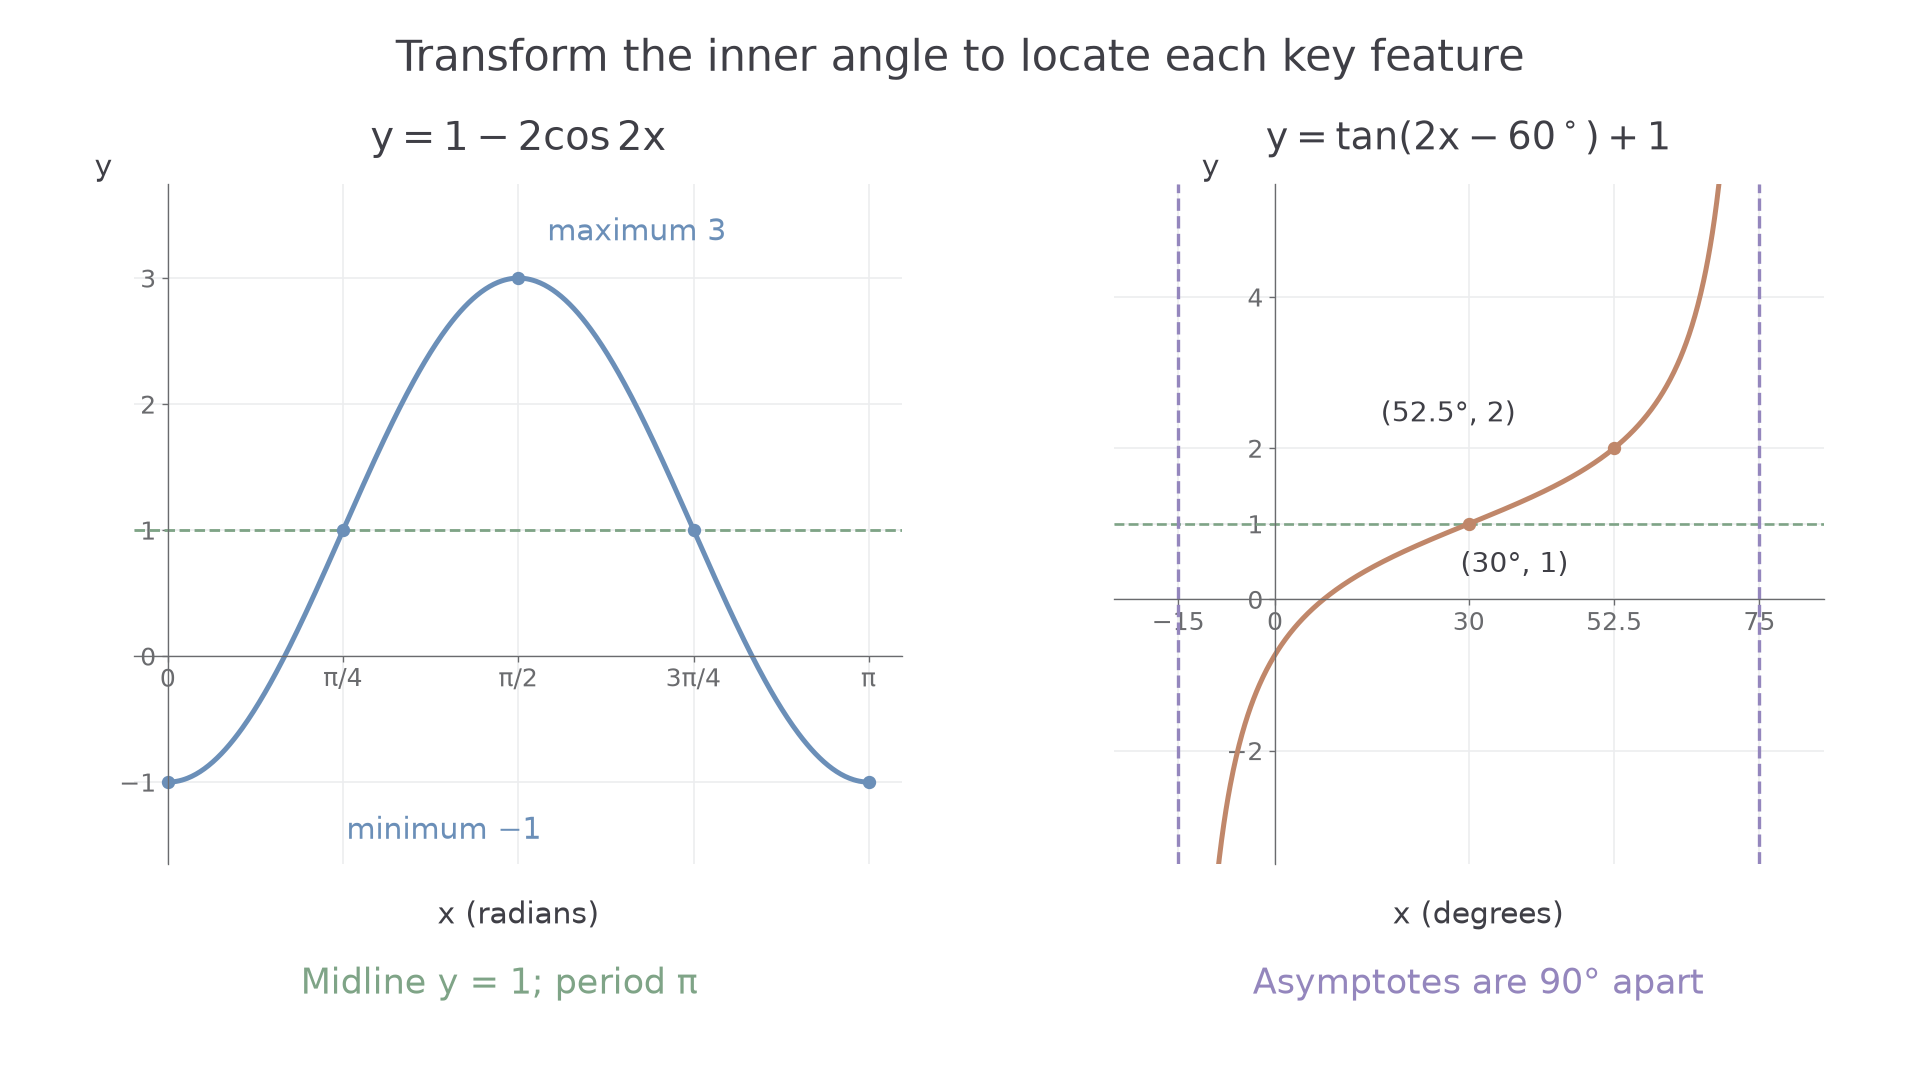
To read a horizontal shift in radians, use the same factoring: shifts the basic sine graph left by and stretches its heights by . Its period stays , because the input coefficient is .
Reading a transformed graph
You can recover a simple sine or cosine equation by separating height from timing. The maximum and minimum determine the midline and amplitude. The horizontal spacing between matching features determines the period, hence the input coefficient. Finally, choose sine, cosine and a shift to match a known point and the direction of travel.
If a wave has maximum and minimum , its midline is and its amplitude is . A maximum at suits positive cosine; a midline crossing that rises at suits positive sine. These are convenient choices, not unique representations of the curve.
Worked example 5: reconstructing a wave
Question. A sinusoidal graph has maximum , minimum , and consecutive maxima at and . Give one equation for it.
Plan. Find the midline, amplitude and period; choose cosine because the graph starts at a maximum.
The period is , so gives . A positive cosine reaches its maximum when the inner angle is zero.
Answer. , with in degrees.
Check. At and , the value is . Halfway between, at , the value is , the stated minimum.
An equation can also be read from two graphs. Where and intersect, their heights agree, so each intersection's input solves . Count every intersection in the stated interval, including an endpoint if it is included and satisfies the equation.
[DIAGRAM: asset_name: Recovering and reading graphs; asset_slug: reading-trigonometric-graphs; caption: The extrema and period determine a simple wave, and intersections with a horizontal line give equation roots; description: Left shows a sinusoidal graph with maxima 4 at 0 and 180 degrees, minima minus 2 at 90 and 270 degrees, and midline 1. Right shows y equals 2 sine x and y equals 1.2 for x from 0 to 360 degrees, with intersections A and B, a 30 degree horizontal grid, and dashed projections from each intersection to the input axis.]
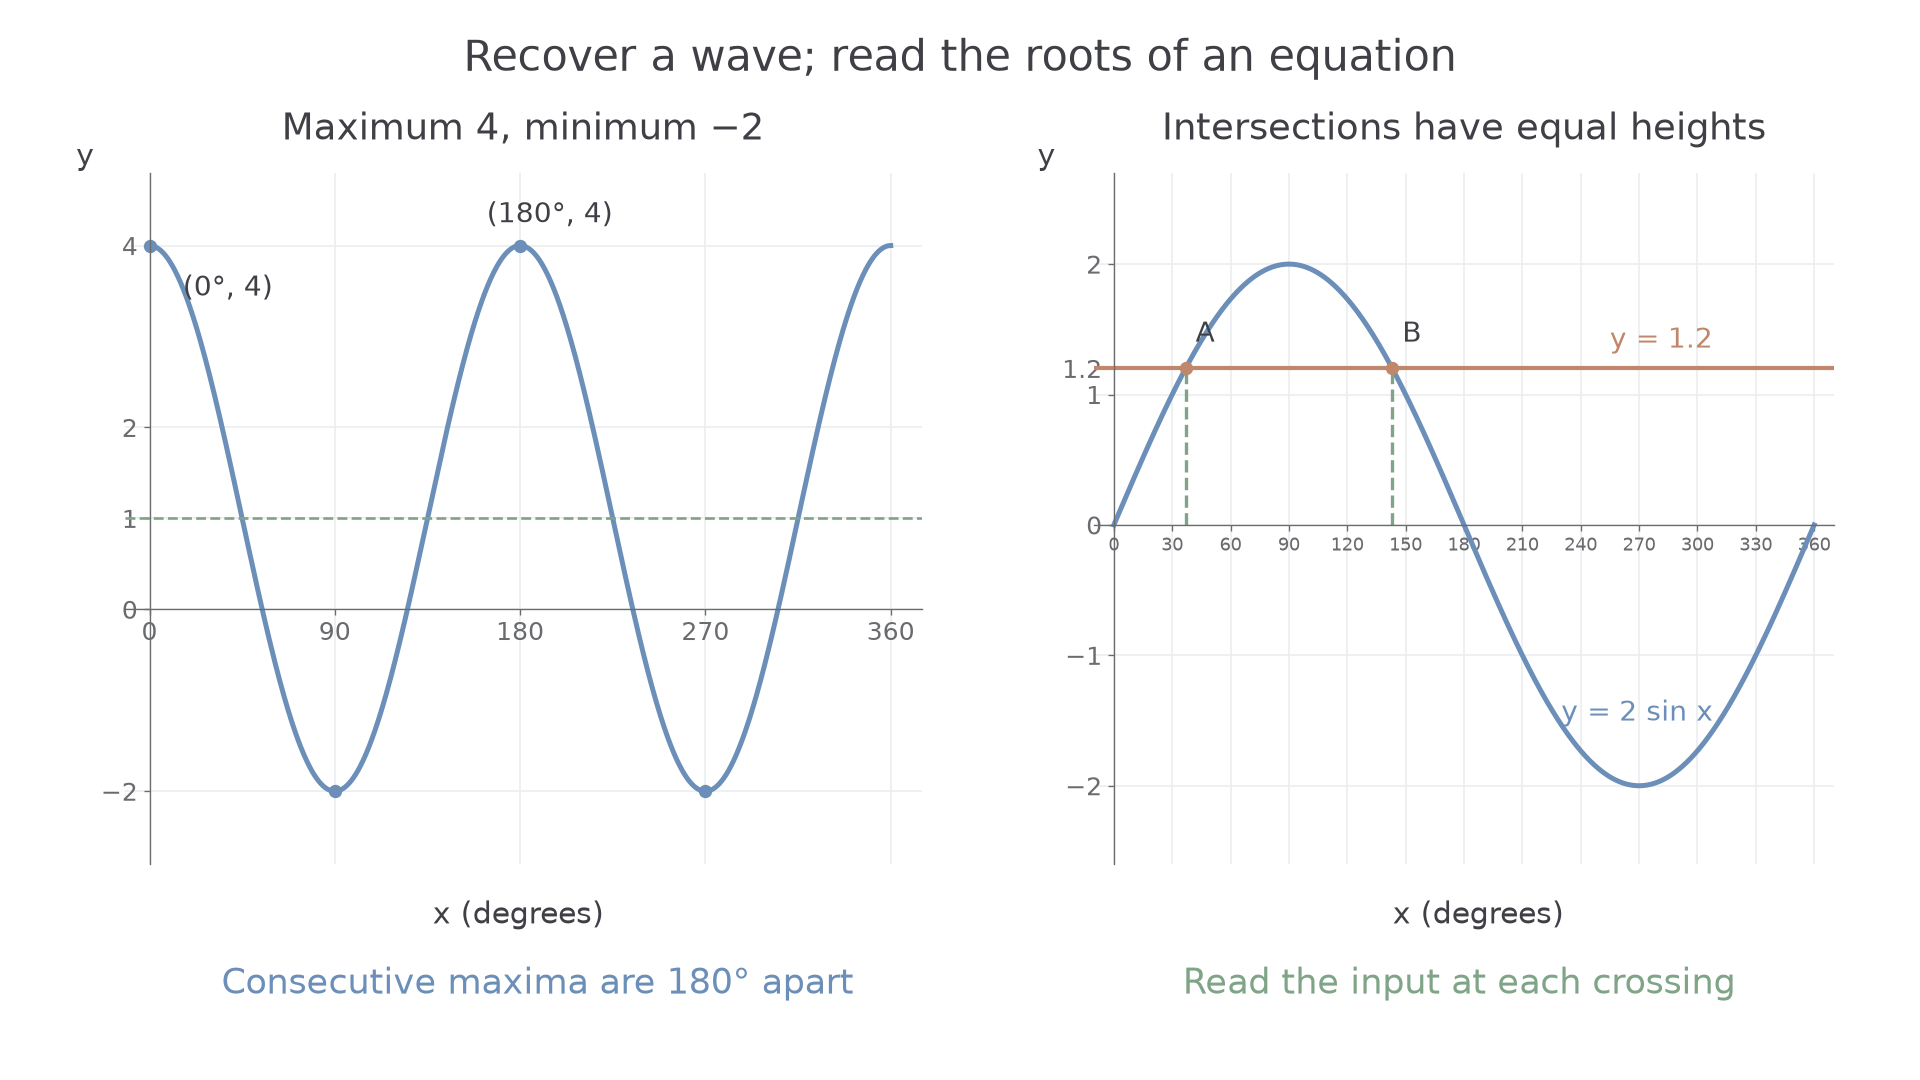
Now use the second panel for a graphical solution rather than guessing from one calculator inverse value.
Worked example 6: reading both intersections
Question. Use the graph to estimate the solutions of for .
Plan. Read the inputs where the sine curve crosses the horizontal line .
The first crossing is a little beyond , at about . The second is between and , at about . The curve is below the line for the rest of the interval, including both endpoints.
Answer. and .
Check. and . Their sum is , matching sine's symmetry about . The graph supports approximate, rather than exact, angle readings.
Graphical reasoning gives both a count and an estimate of the roots. Algebraic equations in the next lesson will use the same repeating shapes to make sure no roots are missed.
Key idea
Read height, spacing and position separately. A correct period alone does not fix the amplitude or the horizontal shift; one intersection alone need not give every solution.
Use a rising midline crossing to choose between a simple sine and cosine description.
Quick Recap
- Sine and cosine have period ; tangent has period and vertical asymptotes where cosine is zero.
- For sine and cosine, the outside multiplier controls amplitude and the inner multiplier controls period.
- Factor the inner expression before reading a horizontal shift.
- Extrema, period and one phase feature reconstruct a simple wave; intersections give solutions in an interval.