3.4.2.3 - Triangular, logarithmic and dispersion graphs
Specialist graphs reveal composition, multiplicative change and the distribution of observations. Learn to read their scales, choose them for suitable geographical data and avoid misleading comparisons. All datasets below are original illustrative training data; graph construction is ungraded practice.
Three-component composition
A triangular graph locates a mixture described by three percentages that sum to 100%, so each point represents a complete composition.
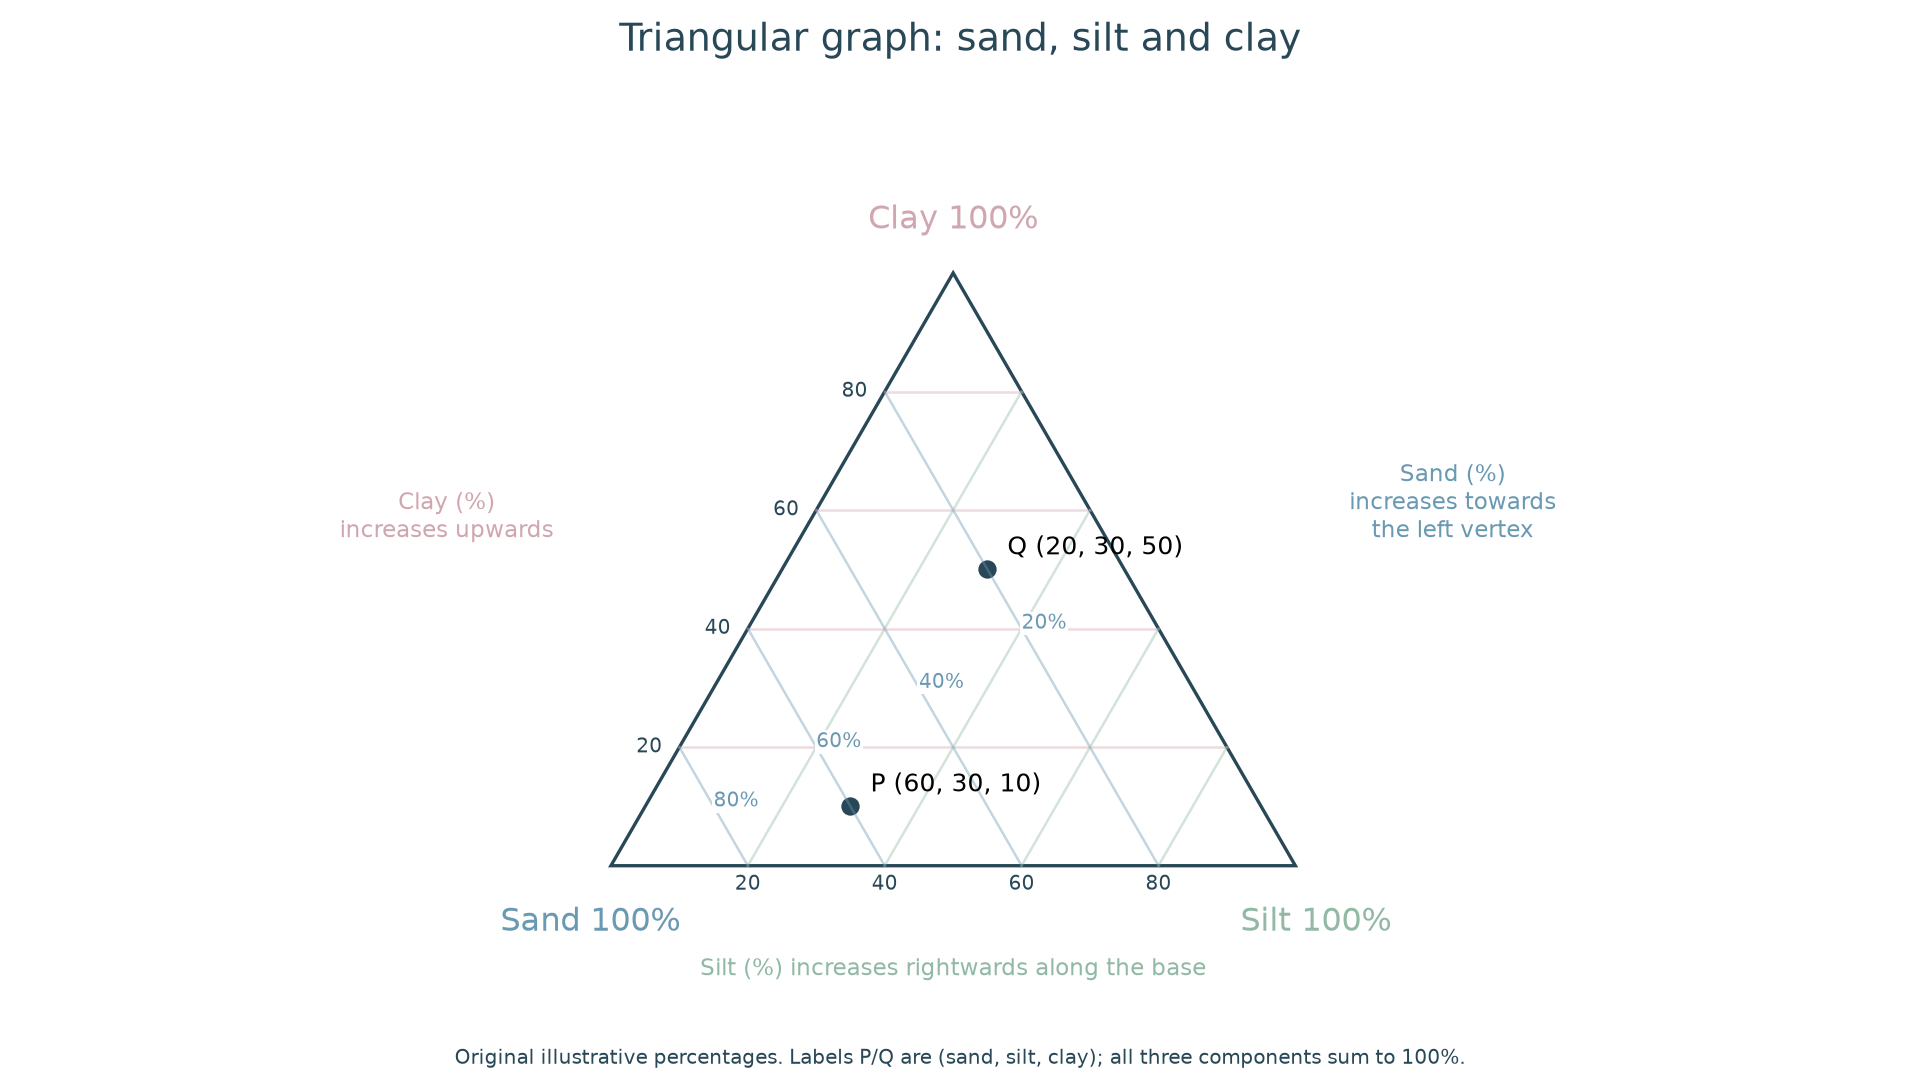
Here the left corner is 100% sand, the right 100% silt and the top 100% clay. The side opposite a component's corner is 0% of that component. Lines parallel to that opposite side hold its percentage constant: horizontal lines give clay, lines parallel to the right side give sand, and lines parallel to the left side give silt. Check the labelled direction of increase because other triangular graphs can arrange components differently.
P contains 60% sand, 30% silt and 10% clay. Trace its parallel lines to the component scales; the three readings sum to 100. Q contains 20% sand, 30% silt and 50% clay. Relative to P, Q has 40 percentage points less sand and 40 points more clay, with the same silt percentage. Their positions indicate this compositional contrast, not sediment volume or a spatial distance between sampling sites.
To plot a mixture in a notebook, first check that the percentages use the same total and sum to 100. Follow the relevant constant-percentage lines from two scales; their intersection determines the point. Use the third percentage as a check. A sediment sample containing 40% sand,40% silt and 20% clay lies on the20% horizontal clay line where the40% sand and silt lines meet. Values that sum to 110% cannot be plotted as a complete composition without resolving the data defect; silently rescaling changes the evidence.
Triangular graphs suit exhaustive three-part mixtures, such as sediment fractions, and reveal grouping or compositional change. A photograph or classification key may be needed to explain sediment origin. The graph alone cannot prove a depositional process or compare total mass. Keep the sampled fraction, laboratory method and site selection consistent when comparing real samples.
Logarithmic scales and ratios
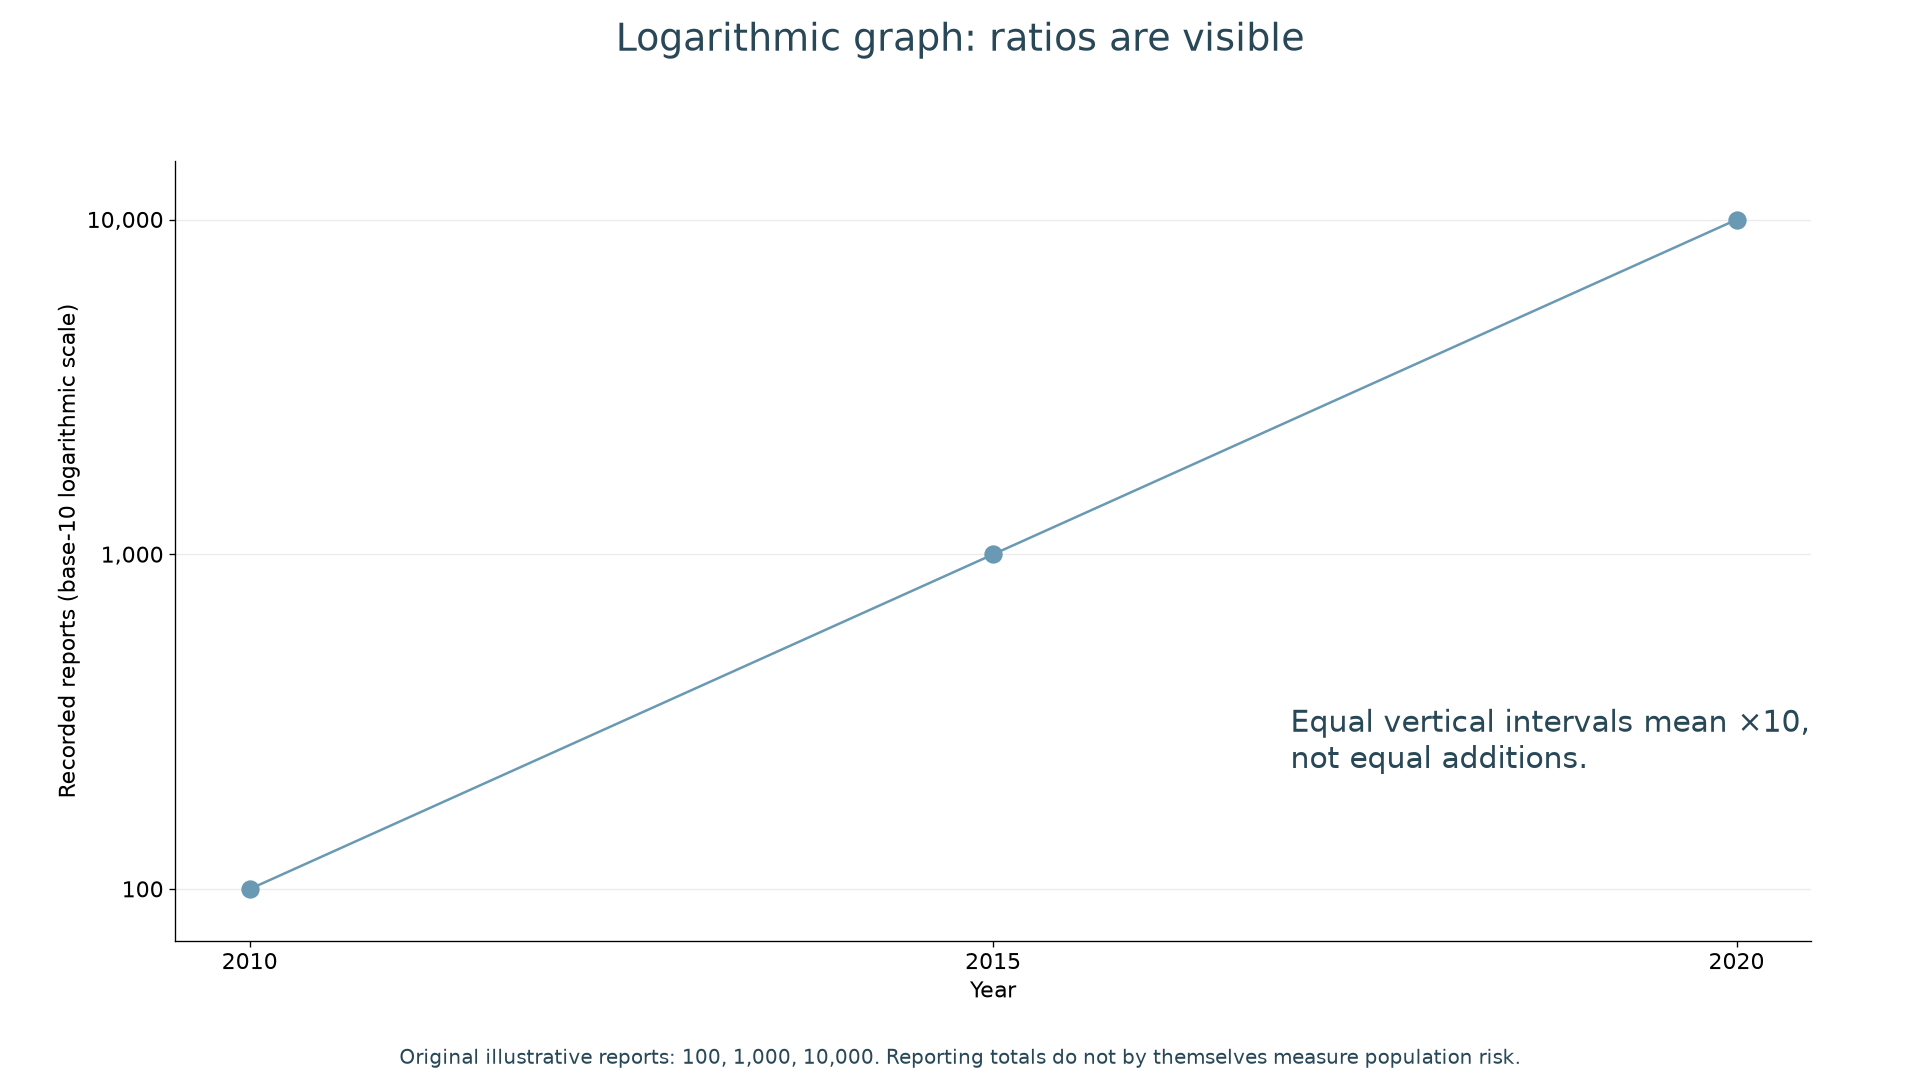
A logarithmic scale compresses a wide range while preserving multiplicative relationships, so equal distances represent equal ratios rather than equal additions.
Continue this lesson.
You’re previewing NovaLearn without an account. Create a free account to read the rest.
Create free account