3.1.1.6, 3.1.1.5 - A local river catchment and field evidence
Use the River Irwell in Greater Manchester as a complete worked local case, from upland rainfall to measured river response and flood management in Salford. Then adapt its enquiry logic to a catchment near your own home or study centre; studying this published example is not a claim that you conducted fieldwork there.
Defining the Irwell enquiry
A local enquiry needs a clear outlet and contributing area, rather than treating a council boundary as a drainage divide.
The Irwell drains upland areas north of Manchester through Rossendale, Bury and towards Salford. The Roch and Croal are tributaries within the wider river system. Rain in the upper catchment can therefore affect lower settlements even when rainfall there is less intense. The worked enquiry asks how the Christmas Day–Boxing Day 2015 rainfall affected river levels, and how later temporary storage in Salford changes flood routing.
Use two nested boundaries: the area upstream of the Bury Grounds gauge for its measured response, and the larger area contributing to the downstream Manchester Racecourse gauge in Salford. The latter name is the report's gauge name, not a statement that its local-authority area is Manchester. A basin map should show tributaries, topographic divides and the chosen outlet; a street map of Salford alone cannot identify every upstream rainfall input.
The Greater Manchester flood investigation, published September 2016, brings together agency and council evidence for the 26 December 2015 event. Its rainfall and river-level measurements are genuine published field records. They were collected by monitoring organisations and then analysed in the investigation, rather than invented for this lesson or attributed to a learner.
Analysing the published measurements
Measured rainfall and river levels establish the event's input and response, but their units and aggregation constrain the conclusions.
The report's Appendix 3 gives maximum 24-hour rainfall totals of 108.8 millimetres at Holden Wood, 102.8 at Bacup and 52.2 at Ringley for the event. These are point-gauge totals over the stated duration, not basin-average rainfall or a chronological sequence of three storms.
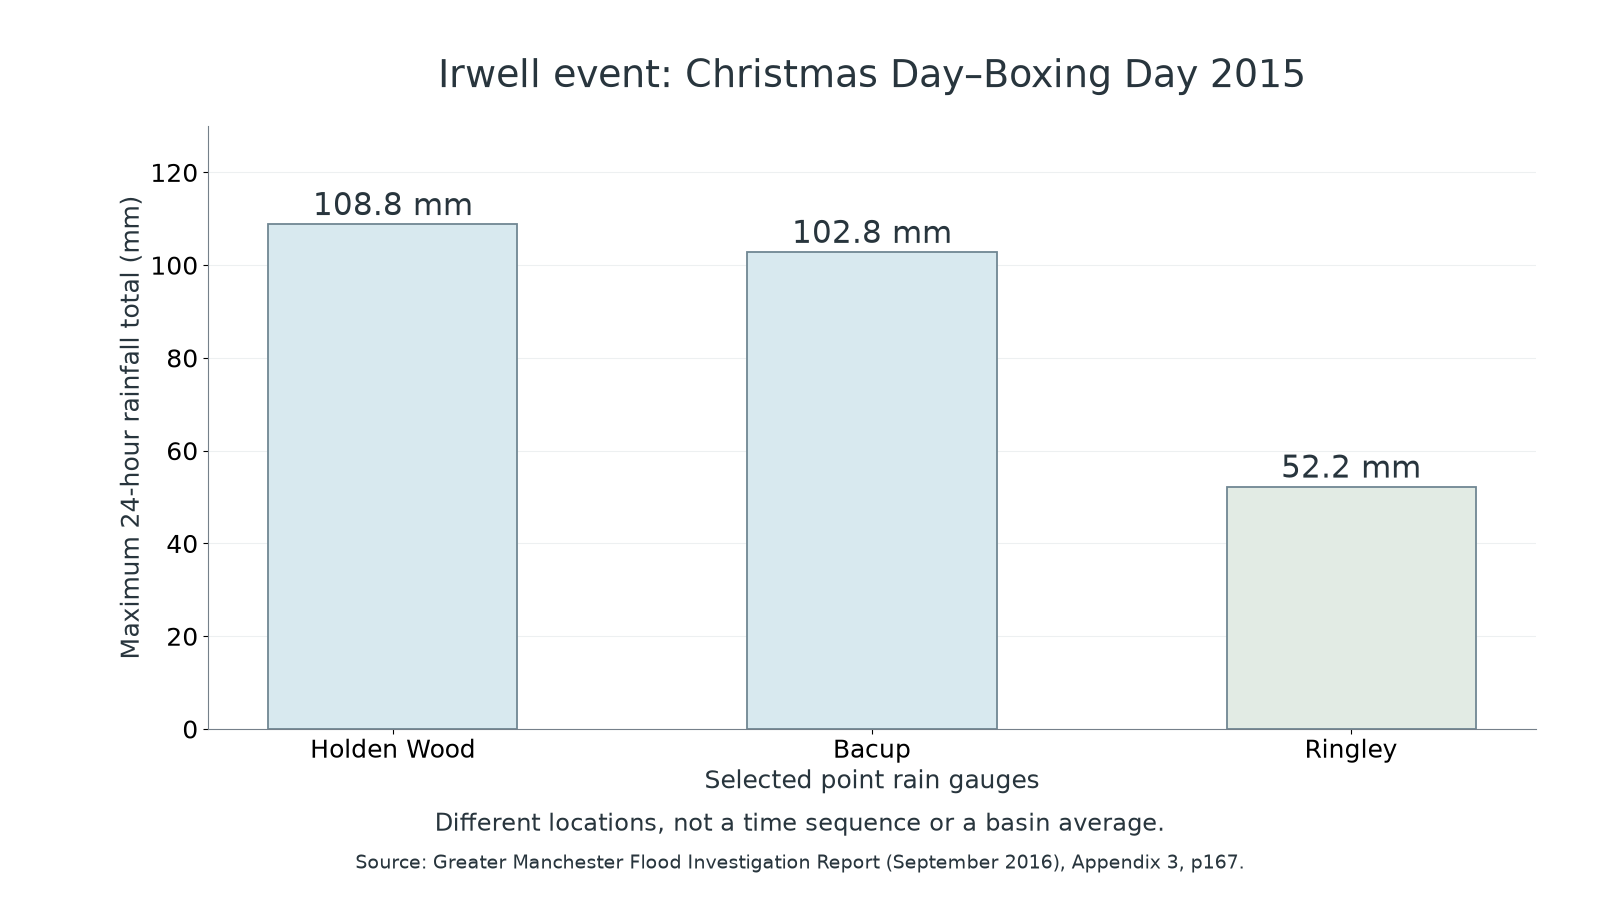
Original plot of three published observations, from Greater Manchester Flood Investigation Report, Appendix 3, page 167. The gauges sample different locations; the bars do not show their order in time.
Holden Wood exceeds Ringley by 56.6 millimetres, about 2.08 times its total. This supports spatially uneven input; averaging these three selected high-event gauges would not give a defensible areal rainfall estimate without spatial weighting and a representative network.
| River Irwell gauge | 26 December 2015 peak gauge level, metres | Previous record peak, metres and date | Record length reported in 2016 |
|---|---|---|---|
| Bury Grounds | 2.178 | 1.758, 22 June 2012 | 37 years |
| Manchester Racecourse, Salford | 5.668 | 4.334, 21 January 2008 | 75 years |
At Bury the peak exceeds its previous record by 0.420 metres; at Manchester Racecourse by 1.334 metres. These within-gauge differences are meaningful. Gauge zeros and channel geometry differ, so 5.668 metres at one station does not mean the flood was 2.6 times deeper than 2.178 at the other. The table gives level, not discharge. Converting level to flow requires a site-specific rating relation whose reliability can change at extreme flows. Different record lengths also qualify 'highest recorded': it does not mean highest possible.
Explaining stores and transfers
The rainfall–response connection is explained by catchment conditions, rather than by the size of a gauge reading alone.
The investigation reports saturated antecedent ground after an unusually wet December, followed by prolonged heavy rainfall in upper areas. Filled soil storage leaves less capacity for further input; additional water can reach channels through saturation-excess overland flow and rapid subsurface routes. Surface depressions may fill and spill, tributaries deliver water downstream, and channel storage rises as inflow exceeds outflow during the rising phase. Rain falling on urban sealed surfaces can also be connected rapidly to drains and channels.
These are mechanisms consistent with the report's observed conditions and exceptional levels. The selected tables do not measure every soil store, the volume of interception or separate groundwater and surface contributions. They also do not supply synchronised hourly peak times from which to calculate exact lag. The report's river-level curves and dated observations can add timing evidence; a level peak still must not be relabelled a measured discharge peak without conversion.
Triangulate rather than claiming a complete mass balance from incomplete data. Compare the rainfall distribution with mapped contributing areas, dated soil observations and the channel sequence. A photographed flooded road confirms water at that location; it cannot by itself prove which upstream tributary caused it. During recession, drainage from stores can sustain river flow after rain weakens. Neither the peak table nor a qualitative statement of saturation supplies the annual recharge needed to judge sustainable groundwater abstraction.
Evaluating temporary flood storage
Flood storage works by changing the timing of river delivery, so its benefit depends on capacity, operation and the event being managed.
In February 2018 the Environment Agency reported completion of the Castle Irwell flood-storage basin in Salford: 28 hectares with capacity up to 650 million litres, or 650,000 cubic metres. A controlled inlet admits water when the river is high; outlets release it after levels fall. This transfers some water from the channel into temporary surface storage, reducing delivery during the most critical period. It does not permanently remove that water from the basin. The agency described protection for more than 1,900 homes and businesses alongside the existing Littleton Road scheme; that is the stated scheme objective, not a measurement that all future floods are prevented.
The Environment Agency's 2 February 2018 account also describes wetland habitat benefits. Compare the engineering claim with monitored inlet/outlet flows, available storage and a modelled or observed downstream response under similar events. A large storm may fill the basin; poorly timed releases could coincide with a downstream peak. Maintenance and land opportunity costs affect delivery, while wetland access and biodiversity can add benefits.
Combine approaches at their appropriate scales. Local sustainable drainage can delay urban runoff; upstream retention can alter tributary routing; warnings and property resilience reduce impacts when flooding still occurs. They act on different parts of risk, and none should be credited with an unmeasured exact reduction. A sustainable flood strategy needs the catchment's physical connections and the distribution of protection, rather than simply a large storage headline.
Adapting the case to your own catchment
The Irwell provides a method to adapt, while your own local catchment needs its own boundary, observations and management evidence.
Choose a reachable river or tributary near home or your study centre and identify an outlet with a topographic map. Delineate its contributing area and locate rainfall gauges, land cover and relevant storage or drainage features. A useful question is how contrasting cover or antecedent moisture affects a measured response, with site choice and period specified. A single dry-day visit cannot test a storm hydrograph by itself.
Combine published monitoring with observations collected safely under an approved fieldwork arrangement. Repeated soil-moisture or infiltration measurements on comparable covered and compacted sites can examine a store/pathway mechanism; dated photographs and coded field notes explain context. If velocity and cross-sectional area can be measured appropriately, discharge is , with square metres times metres per second giving cubic metres per second. A surface-float speed is not automatically mean cross-section velocity, and irregular depth, turbulence and changing flow introduce error. Never improvise entry into floodwater to fill a data gap; existing gauge records can supply the event evidence.
Present time series with units, sampling intervals and missing data; compare like quantities and keep observation separate from inference. Match rain and river clocks, use representative sites, repeat measurements and retain uncertainty or quality flags. A relationship between two variables alone does not demonstrate a cause. Supplement physical measurements with named management documents and perspectives from affected groups, recording who provided an account and when.
The outcome is an evidence-based local comparison, not a copy of Irwell values applied to another basin. Document what was actually observed, what remains inferred and which proposed management mechanism the evidence can test. This worked example neither certifies fieldwork days nor supplies an assessed independent investigation for a learner.