3.2.2.2.1 - Economic change and social inequalities
Learn how restructuring changes work and opportunities, why benefits can be unequal, and how social statistics and maps connect to people's lives.
Restructuring and opportunity
Economic change concerns how a place produces, exchanges and supports livelihoods, including who can take part.
Economic restructuring
A change in the organisation and composition of economic activity, such as a shift between industries, technologies or forms of employment.
Wider competition, changing demand and new technology may reduce employment in an established industry. An employer's closure can remove wages, reduce spending in nearby shops and interrupt supplier networks. Buildings and skills may remain, but neither transfers automatically into a different industry. Reuse needs investment, appropriate premises, training and connections to customers. New services may employ different people on different pay, hours or contracts, so a restored job total need not restore the earlier livelihoods.
Salford City Council describes Quays' former docklands as a mixture of residential, employment and leisure uses, with a creative/digital/media cluster at MediaCity. This is a particular locality's functional change, not proof of equal district-wide prosperity. Council area policies, 8.8–8.9. Detroit's Factory ZERO provides a different restructuring example: Michigan's January 2021 release reported GM investment in electric-vehicle assembly and road support at a plant across the Detroit–Hamtramck boundary. Its intended jobs were a projection at that date, not a measured outcome for all Detroit residents. Michigan government.
To explain opportunity, follow investment through actual requirements: recruitment, skills, shift times, transport and care responsibilities. A nearby job can be inaccessible to a resident without the required qualification or an affordable route. Economic character and lived experience therefore need to be examined together.
Inequality and social statistics
Social inequality is a difference in access to resources and opportunities between people, rather than a synonym for an area's average income.
Social inequality
Unequal access to income, housing, services, security or opportunities between people or groups; it can also have a spatial pattern.
Some households may gain wages or property value while others face higher rent or insecure work. Income affects housing choice and access to services; housing costs in turn affect disposable resources and the ability to remain near social networks. Tenure matters: a property-price rise can benefit an owner but increase pressure on a renter. Inequality can also concern transport, health, education and social participation. One indicator cannot capture every dimension.
Read each statistic's denominator. An unemployment share of all adults differs from a rate among economically active people. For Salford local authority, ONS reports the employed category excluding full-time students as 53.7% of residents aged 16+ in 2011 and 56.4% in 2021: +2.7 percentage points. This is not the percentage of new jobs filled by local residents. Census 2021's pandemic and furlough conditions limit a simple labour-market comparison. ONS, employment section, 19 January 2023.
An area average may conceal differences between households or neighbourhoods. A change can also reflect incoming and departing residents rather than improved circumstances for the same people. Compare distribution, composition and access before claiming that inequality has narrowed. A deprivation index combines defined indicators to compare areas; its rank is relative, not a percentage deprived or a measure of every resident. Comparisons across editions require compatible indicators and boundaries, not subtraction of ranks alone.
Reading choropleth patterns
A choropleth shades areas by a measured value, making spatial differences visible while concealing variation inside each area.
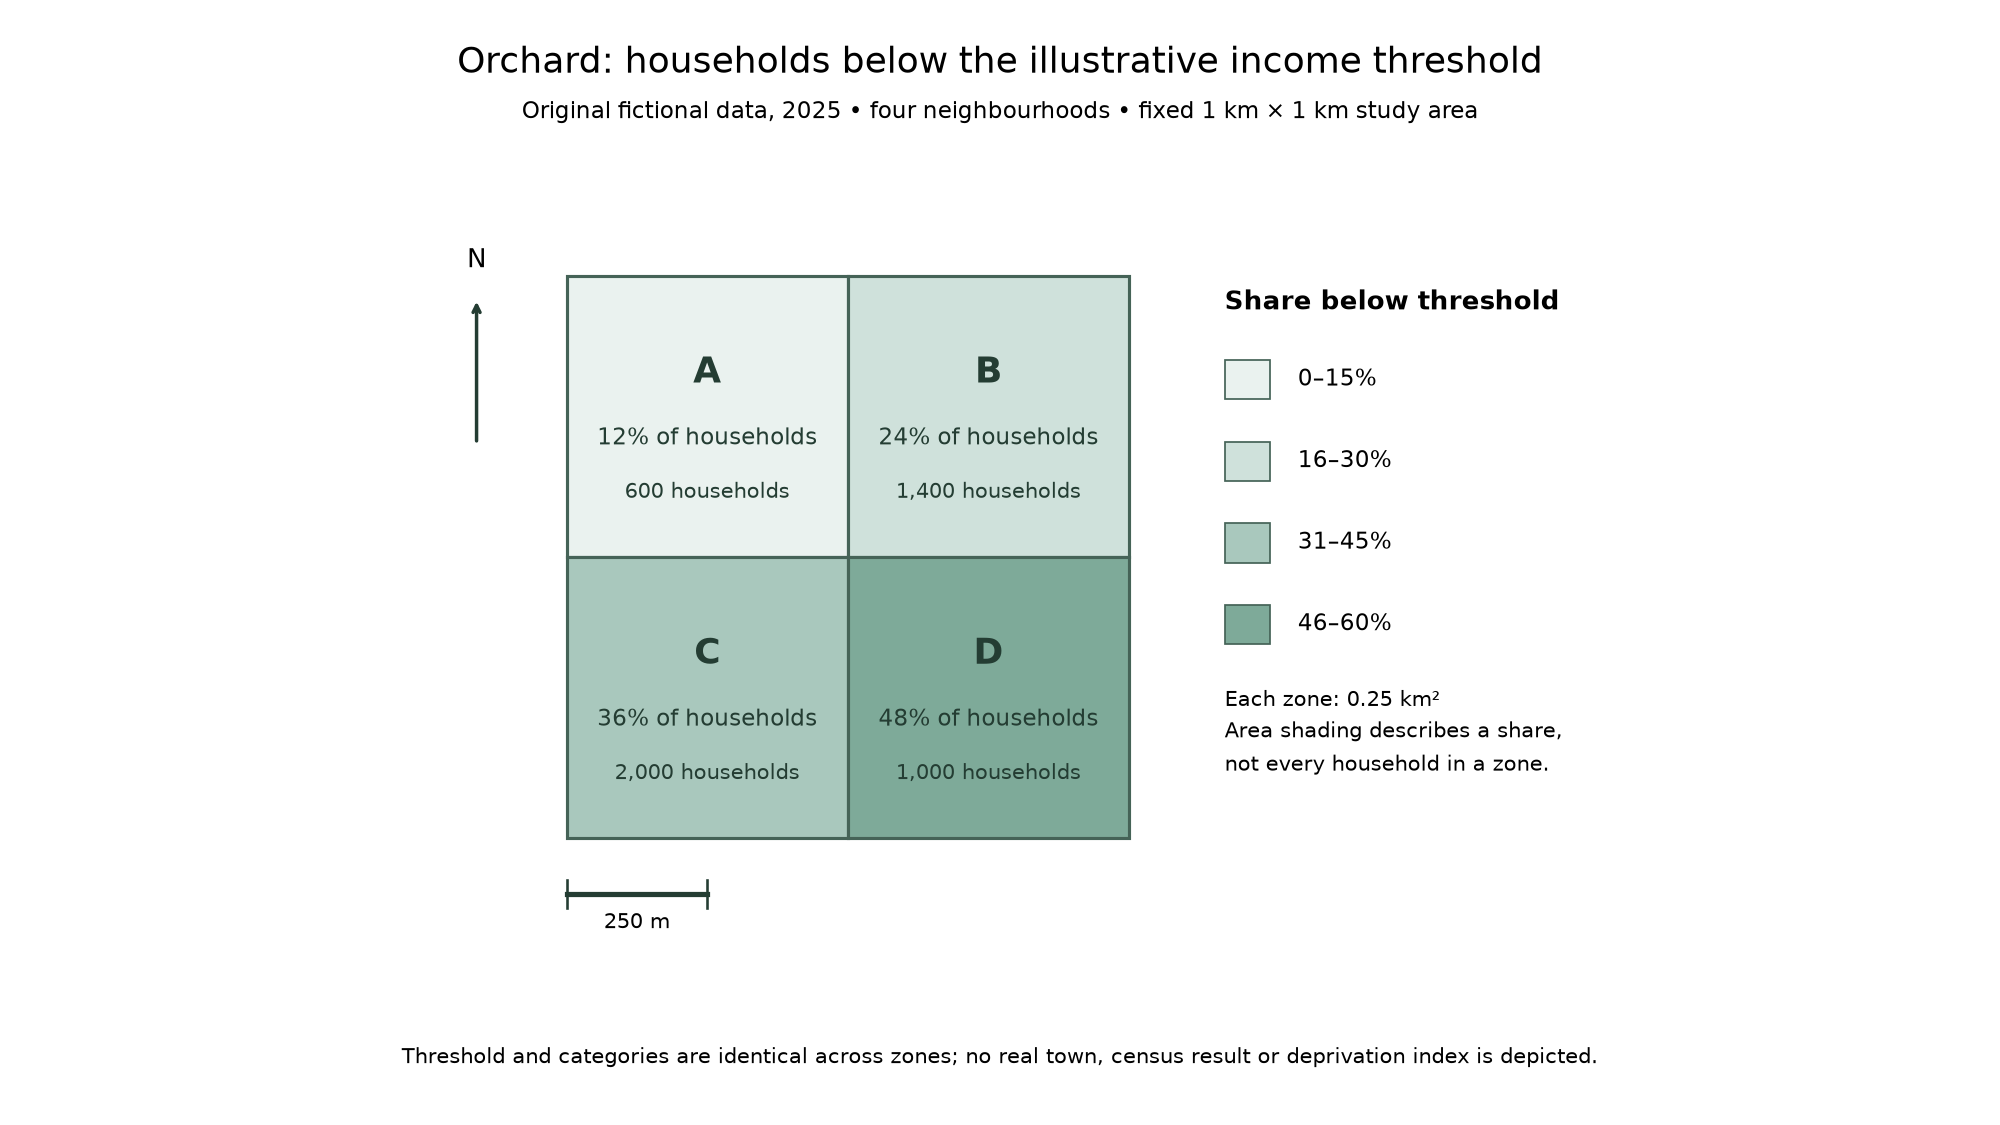
This original fictional map uses the same income threshold and date throughout a fixed 1 km × 1 km area. Darker shades mean a higher share of households below the threshold. The share increases from north to south, and within each row from west to east. D is highest at 48%, four times A's 12%; the gap is 36 percentage points. These are spatial comparisons, not a claim about the cause.
The highest share is not the highest number. D has 0.48 × 1,000 = 480 households below the threshold; C has 0.36 × 2,000 = 720. All four zones have equal land area, yet unequal household totals. Across Orchard, the number is 72 + 336 + 720 + 480 = 1,608 out of 5,000, or 32.16%. Averaging the four percentages gives 30%, which wrongly weights each zone equally despite different denominators.
Read legend intervals before judging intensity. Different class breaks could merge A and B into one colour or exaggerate a small gap. Changing boundaries can change averages and apparent clusters. Large shaded areas need not contain the most people, and a dark zone does not mean every household is low income: that would wrongly infer an individual's circumstances from an area aggregate. Use the map with its table and local accounts, and keep the threshold, year, unit and boundary explicit when comparing maps.
Describe location and measured differences, then distinguish area shares from household numbers and individual circumstances.
Inequality in lived experience
People's routines explain how a measured inequality matters, including effects that a job or income total misses.
In an original illustrative waterfront, a new professional values a short walk to work; a night cleaner cannot use the daytime bus; an older resident values a free meeting place but finds nearby shops expensive. These accounts identify mechanisms through which skills, timing, money and social access matter. They are not observed interviews or proof that every person in each category has the same experience. The cleaner's barrier can persist even where employment expands, while the older resident can retain attachment alongside difficulty meeting daily needs.
Qualitative evidence adds meaning and causal clues; numerical evidence helps establish how widespread a condition is. A renter's account of pressure cannot measure an area's rent trend, while an area rent trend cannot establish that person's feelings or reason for moving. Compare dated accounts across contrasting users and places, then test proposed explanations against accessible transport, recruitment or housing records. Follow-up evidence might confirm a barrier, identify a different cause or reveal change over time.
The worked Salford–Detroit pair develops economic change/social inequalities as its common focus. Give both places substantial past/present lived-experience evidence as well as economic indicators. Assess a bounded claim such as whether new investment expands accessible opportunities: consider which residents, where, when and on what conditions. A defensible judgement can recognise gains while identifying exclusion or continuity. It should not turn a striking building or a city total into a claim about every resident's life.