3.2.4.7 - A local area's environment, health and experience
Use Salford district as a provider-local example of environment, health and experience. Learn how to combine public data critically and adapt the method to the area around your own home or study centre.
Defining the place and health evidence
Salford district, local-authority code E08000006, is the case-study boundary. A district average, a neighbourhood, a monitoring point and a group of survey respondents describe different populations.
Healthy life expectancy estimates years lived in good health under the period's mortality and self-reported health conditions. It is distinct from total life expectancy and is not an individual forecast. ONS's 2022–2024 estimates were published on 19 February 2026.
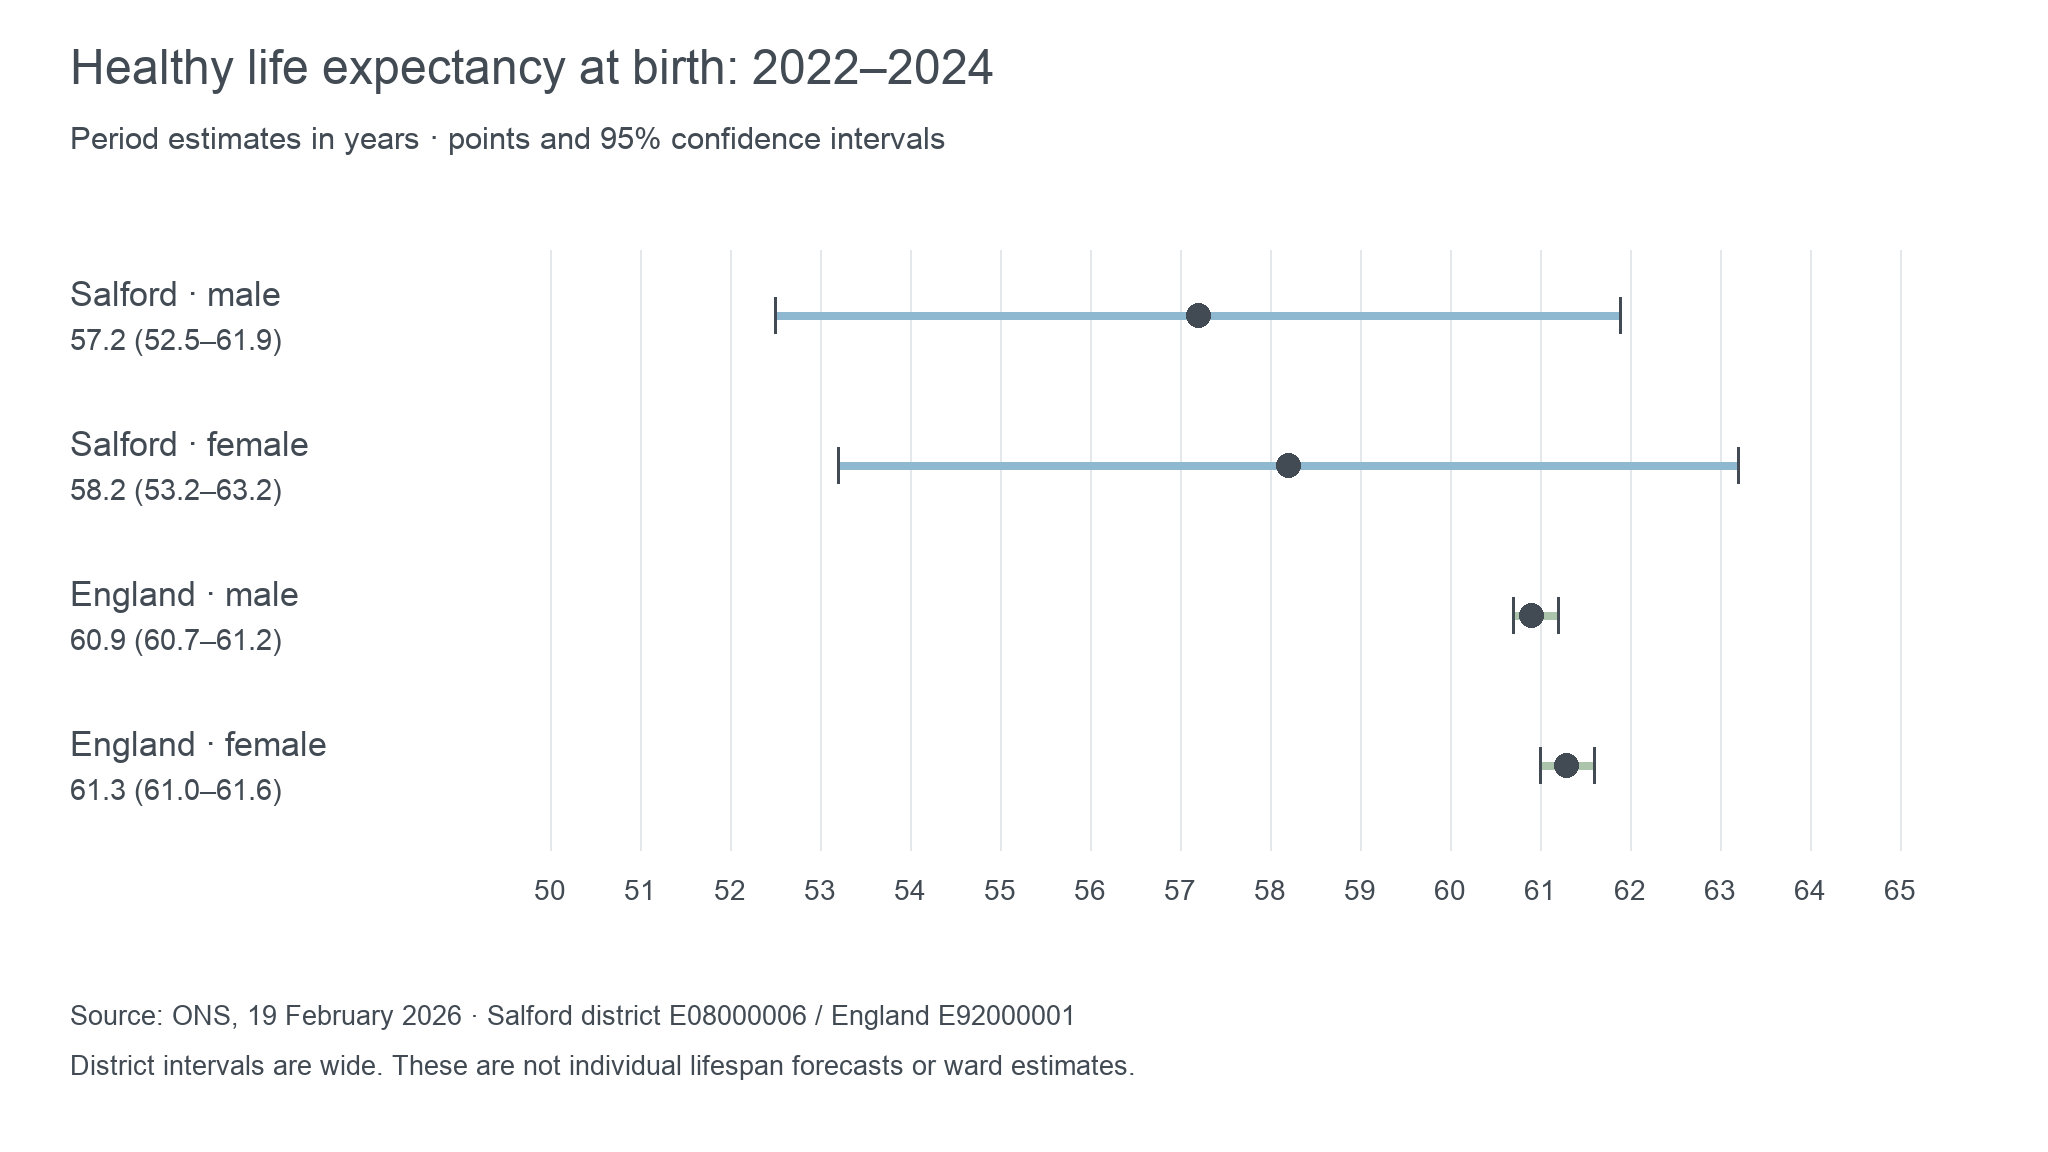
Male healthy life expectancy is estimated at 57.2 years in Salford versus 60.9 in England; female estimates are 58.2 and 61.3. The corresponding Salford 95% confidence intervals are 52.5–61.9 and 53.2–63.2, compared with England's 60.7–61.2 and 61.0–61.6. The point-estimate differences are 3.7 years for males and 3.1 for females. Wide, overlapping intervals mean these displayed differences alone do not establish a statistically clear gap. Confidence intervals describe estimation uncertainty, not the span of every resident's health experience.
The earlier 2021 Census district comparison gives approximately 7.4% reporting bad or very bad health after age standardisation, versus 5.3% in England, using rounded category values. This is self-reported health at another date, not the same measure as healthy life expectancy. It can add context, but cannot be spliced into one time series.
Physical environment and exposure pathways
Air quality, drainage, housing and accessible green space can influence health through different exposure pathways. Measuring one environmental condition does not measure every person's dose or illness.
Salford Council's 2026 monitoring workbook reports the following automatic-site annual nitrogen dioxide means for 2025. The units are micrograms per cubic metre, or µg/m³.
| Site | Site type | 2025 annual NO₂ mean | Data capture |
|---|---|---|---|
| M60, Worsley | Roadside | 31 µg/m³ | 99% |
| Eccles | Urban background | 18 µg/m³ | 96% |
The roadside value is 13 µg/m³ higher, consistent with greater proximity to traffic emissions. NO₂ exposure can irritate airways and worsen respiratory illness, but these site measurements do not establish the pollution dose of every resident or explain the district's healthy life expectancy. Wind, street layout, time spent indoors, travel and earlier exposures affect actual dose. Both values being below the workbook's annual objective of 40 µg/m³ does not mean pollution has no health effects.
Poor drainage can create damp conditions or flood disruption; damp housing can affect respiratory health and stress. Green space can offer cooling, exercise and social contact, but its accessibility, safety and quality matter. These are plausible pathways to investigate locally, rather than additional measured Salford outcomes in this lesson.
For a spatial comparison, locate the named sites within the chosen boundary and classify roadside versus background before averaging. Repeated observations improve temporal coverage. A single point, or an uncalibrated classroom observation of traffic, cannot be presented as a district-wide pollution measurement.
Socio-economic conditions and health mechanisms
Income, employment, education and housing shape people's exposure and their ability to respond. They can interact with the physical environment instead of providing a separate explanation.
The council's Wider Determinants of Health report, Autumn 2024, reports Salford as the 18th most deprived English local authority under the 2019 Index of Multiple Deprivation. This is a historical relative rank, not a current 2026 measurement or the proportion of residents in poverty. Its district-level 2022/23 employment rate is 73.1%, versus England's 75.7%; average Attainment 8 is 41.5, versus 46.2. The latter summarises GCSE-level results and does not measure individual health.
Insecure or low income can restrict nutritious food, heating and transport to services, while financial uncertainty adds stress. Poor housing can combine cold or damp with respiratory vulnerability. Education and secure work can improve resources and control over circumstances; unhealthy or hazardous work can create exposure despite providing income. Illness can also reduce employment and earnings, making the relationship two-way.
These district comparisons support questions about inequality; they do not prove that low attainment causes one person's disease. Age, previous occupation, behaviour, housing and access can confound an association. Establishing causality requires evidence of timing, plausible mechanisms and alternative explanations, ideally with suitable longitudinal or intervention evidence.
A targeted response should address the pathway identified. Housing improvements may reduce damp exposure, while income or transport support may improve access. Health services remain necessary, but treating illness alone may leave its environmental or social conditions in place. Judge reach and distribution, because district improvement can coexist with unequal outcomes within it.
Health experience and attitudes as evidence
People's accounts reveal perceived risks, daily constraints and priorities that aggregate statistics can conceal. The method of collecting those accounts determines how far they can be generalised.
Continue this lesson.
You’re previewing NovaLearn without an account. Create a free account to read the rest.
Create free account