3.3.2, 3.3.4.3 - Analysing, representing and interrogating field data
Learn how 3.3.2 requires suitable analysis and representation, and how 3.3.4.3 connects critical data examination to geographical understanding. The small complete datasets and responses are original fictional practice material, not evidence collected in a candidate's investigation.
Matching analysis to the evidence
Choose a technique for what it can reveal about the question, not for how complicated it appears.
Quantitative evidence records numbers; qualitative evidence preserves meanings, descriptions and experiences. A map locates spatial differences, a scatter graph examines paired quantitative variables, and a dot plot can compare distributions between categories without hiding individual readings. A line graph connects ordered time or distance observations; joining unrelated categories would imply an order that does not exist.
In this original illustrative exercise, six fictional sites have the following infiltration rates:
| Cover | Site rates, mm per hour |
|---|---|
| Bare | 2, 3, 4 |
| Vegetated | 6, 7, 8 |
The bare mean is ; the vegetated mean is . The difference between the means is . A mean summarises the selected readings; it does not prove the groups are representative.
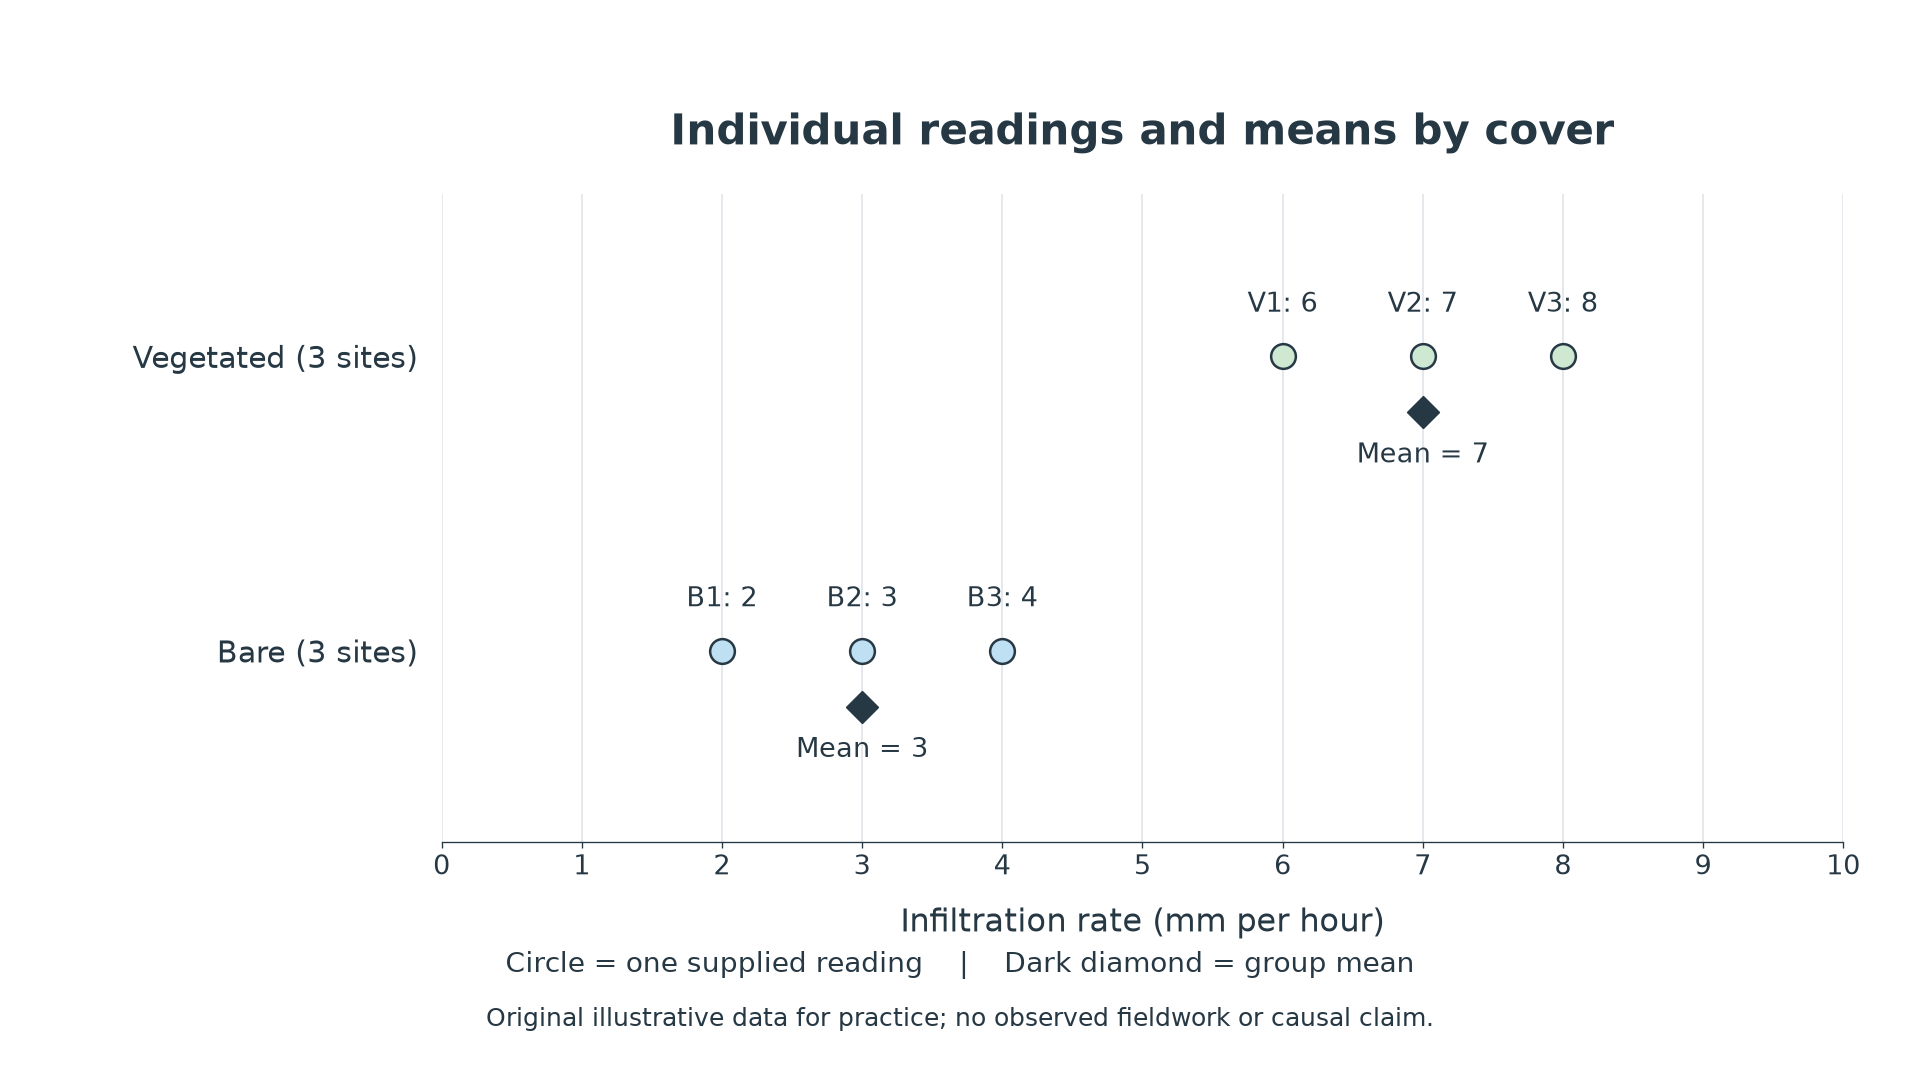
Original illustrative data only. Each dot is one reading; the marked mean summarises each three-site group. The common axis permits comparison, while retained dots show the small sample and spread. This is a training graph, not a map or observed field result.
For a qualitative example, the fictional comments “I meet friends here” and “I avoid it because I feel excluded” can be coded into themes of social connection and exclusion. Coding assigns meaningful categories to evidence. Keep the comments, explain category decisions and retain the contrary experience; counting two themes alone would lose the reasons behind them.
Use suitable statistical tests only when the variables, sample design and assumptions permit them, with significance interpreted conditionally. There is no required number or complexity of analytical techniques. A clear justified simple method can answer a question better than a sophisticated irrelevant test.
Accuracy and representativeness
Critical analysis asks both whether recorded values are dependable and whether they cover the population or conditions to which the conclusion refers.
Accuracy concerns closeness to a true value. An incorrect instrument scale, counting rule or transcription can distort a reading. Repeated measurements, calibration/reference checks and comparisons with raw records help investigate such errors. Consistent repetitions alone do not prove accuracy: the same bias can affect every reading.
Representativeness concerns how well the evidence reflects the relevant population, places and times. The illustrative infiltration graph has only three readings per cover group. If all vegetated points were on one soil and all bare points on another, the apparent cover difference could partly reflect soil type. Sampling only accessible plots could also exclude important conditions. These are interpretation limits even if each value was measured correctly.
Look for missing evidence and anomalies. An extreme reading is not automatically an error; it may identify a relevant local condition. Check the record and method, and explain any reason for exclusion. Do not remove data simply to strengthen the expected relationship. Missing values must not be changed to zeros or invented.
Triangulation compares evidence from different methods or sources to examine a claim. A field note about compaction may help interpret a numerical pattern, but the note and measurement might still share a sampling bias. Agreement strengthens a claim only to the extent that the sources offer relevant, sufficiently independent support.
Continue this lesson.
You’re previewing NovaLearn without an account. Create a free account to read the rest.
Create free account