3.1.1.2, 3.1.1.5 - Runoff and flood hydrographs
A hydrograph shows how a river responds over time. Reading its shape is the first step; explaining that shape requires the rainfall, stores and pathways in the catchment, together with evidence about how the measurements were made.
Reading the storm response
A storm hydrograph plots river discharge against time, so its peak is a rate of flow rather than the total volume of the flood.
Discharge
Discharge is the volume of water passing a river cross-section per unit time, commonly measured in cubic metres per second, .
The rising limb records increasing discharge as storm water reaches the channel. Peak discharge is the highest plotted value; the falling or recession limb records declining discharge as inputs weaken and stored water continues draining. Baseflow is the contribution maintained by delayed sources, often groundwater, between rainfall events. A dashed baseflow estimate is a separation method, not a direct observation of every underground pathway.
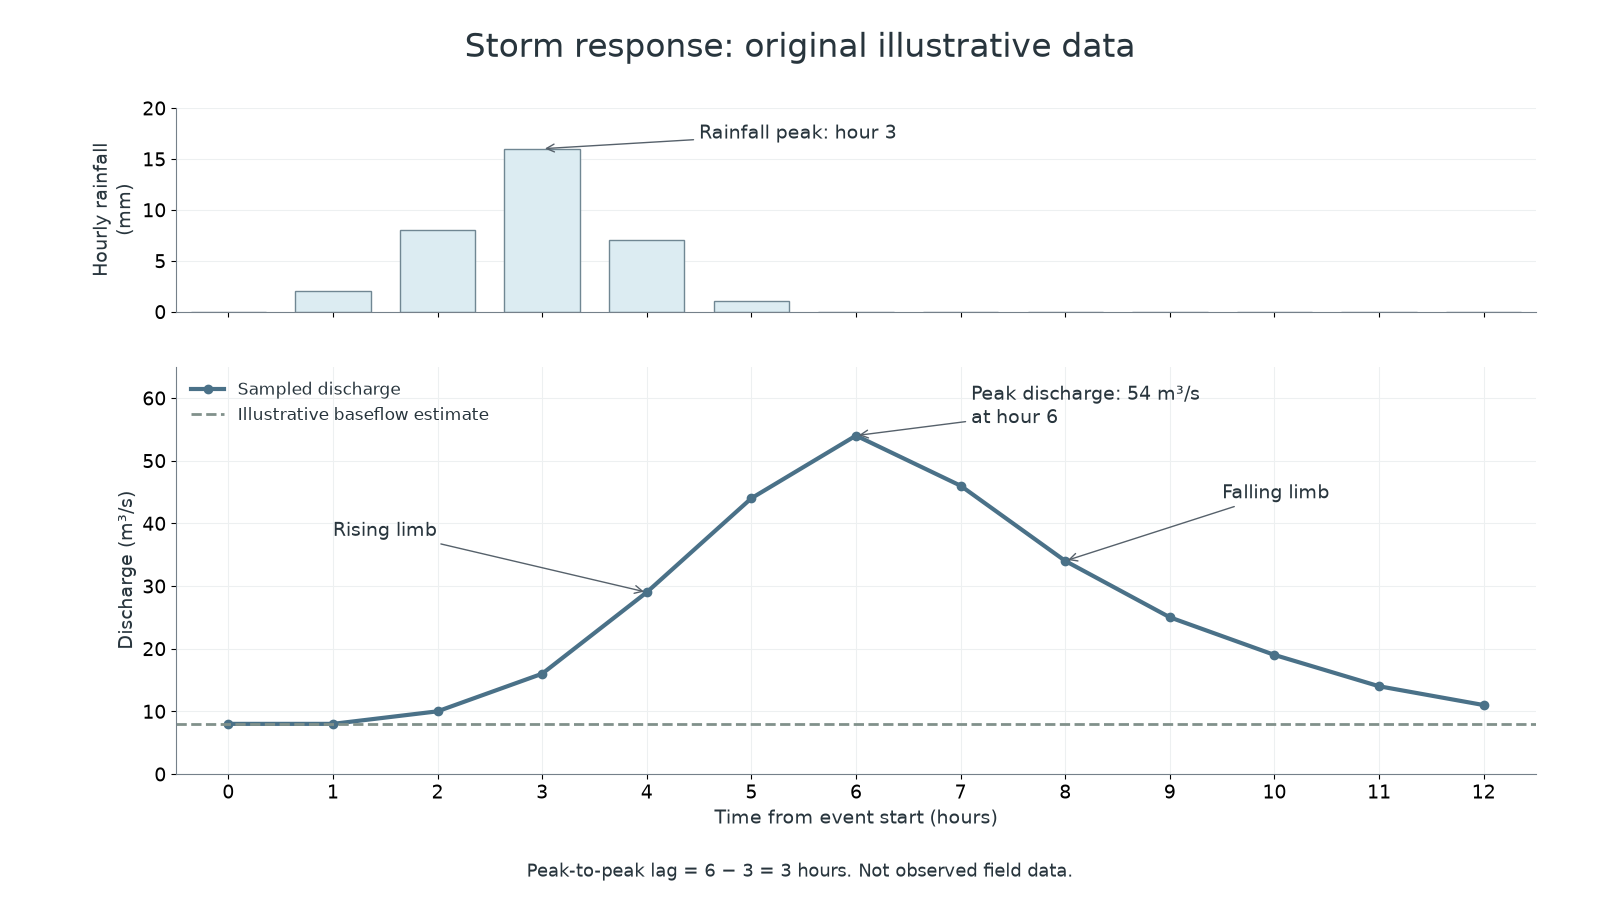
Original illustrative event, not observed field data. Rainfall values are hourly totals; discharge values are hourly instantaneous samples, joined to show their sequence.
Here rainfall peaks at hour 3 and discharge peaks at hour 6: peak-to-peak lag is 3 hours. Do not measure lag from the start of rain unless that different convention is stated. The falling limb is longer than the rapid rise because release from soil and groundwater stores can continue after rainfall stops. Runoff is the catchment's water outflow; overland flow is only one route contributing to it. A high peak increases the chance that flow exceeds channel capacity, but a discharge graph alone does not identify which properties flood.
Why runoff varies
Runoff varies because rainfall supply and the available storage and routes change from one basin or event to another.
Intense rain can exceed infiltration capacity, generating infiltration-excess overland flow. Prolonged rain can fill soil storage until saturation-excess flow occurs even at a lower intensity. Antecedent conditions mean conditions before the event: wet soils have less spare capacity than dry soils. Frozen ground can also restrict infiltration, while melting snow adds water without a new rainfall input.
Permeable soil and rock often favour recharge and delayed flow. Compact clay-rich soil or impermeable rock commonly favours quicker surface routes, although fractured rock can transmit water rapidly. Woodland intercepts rain and its roots can create infiltration pathways; these effects vary with soil, season and storm size. Sealed roads and roofs reduce infiltration, and connected drains shorten travel to rivers. Steeper slopes and a dense drainage network can speed delivery. A compact basin may bring tributary peaks to the outlet at similar times, whereas an elongated basin may spread arrivals; rainfall location can overturn that generalisation.
Separate water volume from delivery rate. Two events may export the same total volume but have different peaks if one delivers it over a shorter period. Conversely, a wet catchment may export more of the rainfall as well as delivering it faster. An explanation should connect a named condition to a pathway or store and then to a hydrograph feature, rather than attaching the label 'flashy' to every urban river.
A short lag and high peak need a routing explanation; a larger runoff volume needs a water-balance explanation. They can occur together but are different claims.
Comparing quantitative evidence
Useful quantitative analysis compares equivalent measurements and states the size of the difference, rather than merely reading two values aloud.
For two original model events, peak discharge rises from 40 to 70. The absolute increase is 30; relative to the first event it is . If lag falls from 6 to 2 hours, it decreases by 4 hours, or about 67%. These calculations describe a stronger, earlier response. They do not demonstrate urbanisation as the cause unless rainfall and other conditions are comparable. A line graph is suitable for a continuous time sequence; rainfall totals are usually bars because each value covers an interval. Clearly label separate rainfall and discharge axes and preserve missing observations rather than inventing a smooth measured line.
A genuine published field-evidence example comes from the Greater Manchester investigation of 26 December 2015: 37 of 44 river-level gauges in the Irwell, Roch and Croal catchments recorded their highest levels in their available records. The share is . This presents the spatial extent of exceptional measured levels, not 84% of the land area or an 84% rise in discharge. Record lengths differ, and water level in metres is not discharge in cubic metres per second. The later local-catchment lesson examines particular gauge measurements and their limitations.
The published flood investigation, section 4.3 and Appendix 3 supplies the observed gauge evidence. The training hydrograph above remains explicitly illustrative.
Explaining a graph with qualitative evidence
Qualitative evidence can explain conditions a hydrograph cannot show, but its timing, location and perspective still need checking.
A geolocated photograph of ponded water, a dated field note describing saturated soil, and an interview describing a newly connected road drain can suggest pathways behind a rapid rise. Code observations into relevant themes, such as soil saturation, surface sealing or channel obstruction, while retaining the original wording and date. Several independently consistent accounts strengthen an interpretation. A recollection that 'the river rose instantly' does not supply a measured lag, and a photograph of one flooded road cannot establish conditions across the basin.
Triangulation means comparing different types of evidence about the same claim. Match rainfall and river times to a common clock, check whether the rain gauge represents the contributing area, and compare upstream and downstream locations. A steep hydrograph plus notes of saturated ground supports rapid delivery under wet antecedent conditions. It does not identify the separate contributions of soil compaction, drains and rainfall intensity without further evidence. Distinguish an observation ('water ponded on this field') from an inference ('infiltration was limited') and a general claim ('all fields were saturated').
When judging evidence, ask what would discriminate between explanations. Repeated infiltration measurements on matched covered and compacted plots could test a soil mechanism; a second rainfall gauge could test storm unevenness. Present the numerical pattern first, then connect the supporting qualitative evidence and its limits. This makes the explanation more precise without turning a plain request to analyse a graph into an unrelated management judgement.