3.2.5.4 - Energy sources, demand and competing interests
Learn how energy services create demand, compare the UK and South Africa using a common primary-energy consumption dataset, and connect physical opportunities with firms and national interests.
Primary energy and energy services
Energy is demanded for services such as movement, heating and production, not simply for the possession of fuel.
Primary energy is energy accounted for before conversion into another carrier: examples include coal, natural gas, petroleum, nuclear energy and renewable sources. Secondary energy is produced by converting primary sources; electricity and refined fuels are examples. Electricity is not itself a primary fuel, and its sustainability depends on its supply chain.
Conversion and transmission involve losses. A thermal station converts only part of fuel energy into electricity; useful end-use efficiency also matters. Comparing primary consumption with electricity generation mixes answers different questions. Primary-energy accounting conventions affect comparisons between combustion, nuclear and non-combustible sources.
Demand components include domestic heating/cooling and appliances, industrial processes, transport, agriculture and services. Climate changes heating or cooling needs; urban form and transport options affect travel; economic structure changes industrial demand. Access, income, prices and technology alter the service people can obtain. More electricity consumption can reflect improved access rather than waste.
Matched primary-energy consumption mixes
The UK–South Africa comparison uses the same provider, year, activity and units so that the mix contrast has a consistent basis.
EIA International Statistics, frozen on 2 October 2026, provides annual 2022 primary-energy consumption in quadrillion Btu (QBTU). Preserve its five component categories:
| EIA category | UK QBTU | South Africa QBTU | UK normalised share % | South Africa normalised share % |
|---|---|---|---|---|
| Coal | 0.158 | 3.863 | 2.34 | 71.15 |
| Natural gas | 2.671 | 0.139 | 39.54 | 2.56 |
| Petroleum and other liquids | 2.808 | 1.234 | 41.57 | 22.73 |
| Nuclear | 0.375 | 0.101 | 5.55 | 1.86 |
| Renewables and other | 0.743 | 0.092 | 11.00 | 1.69 |
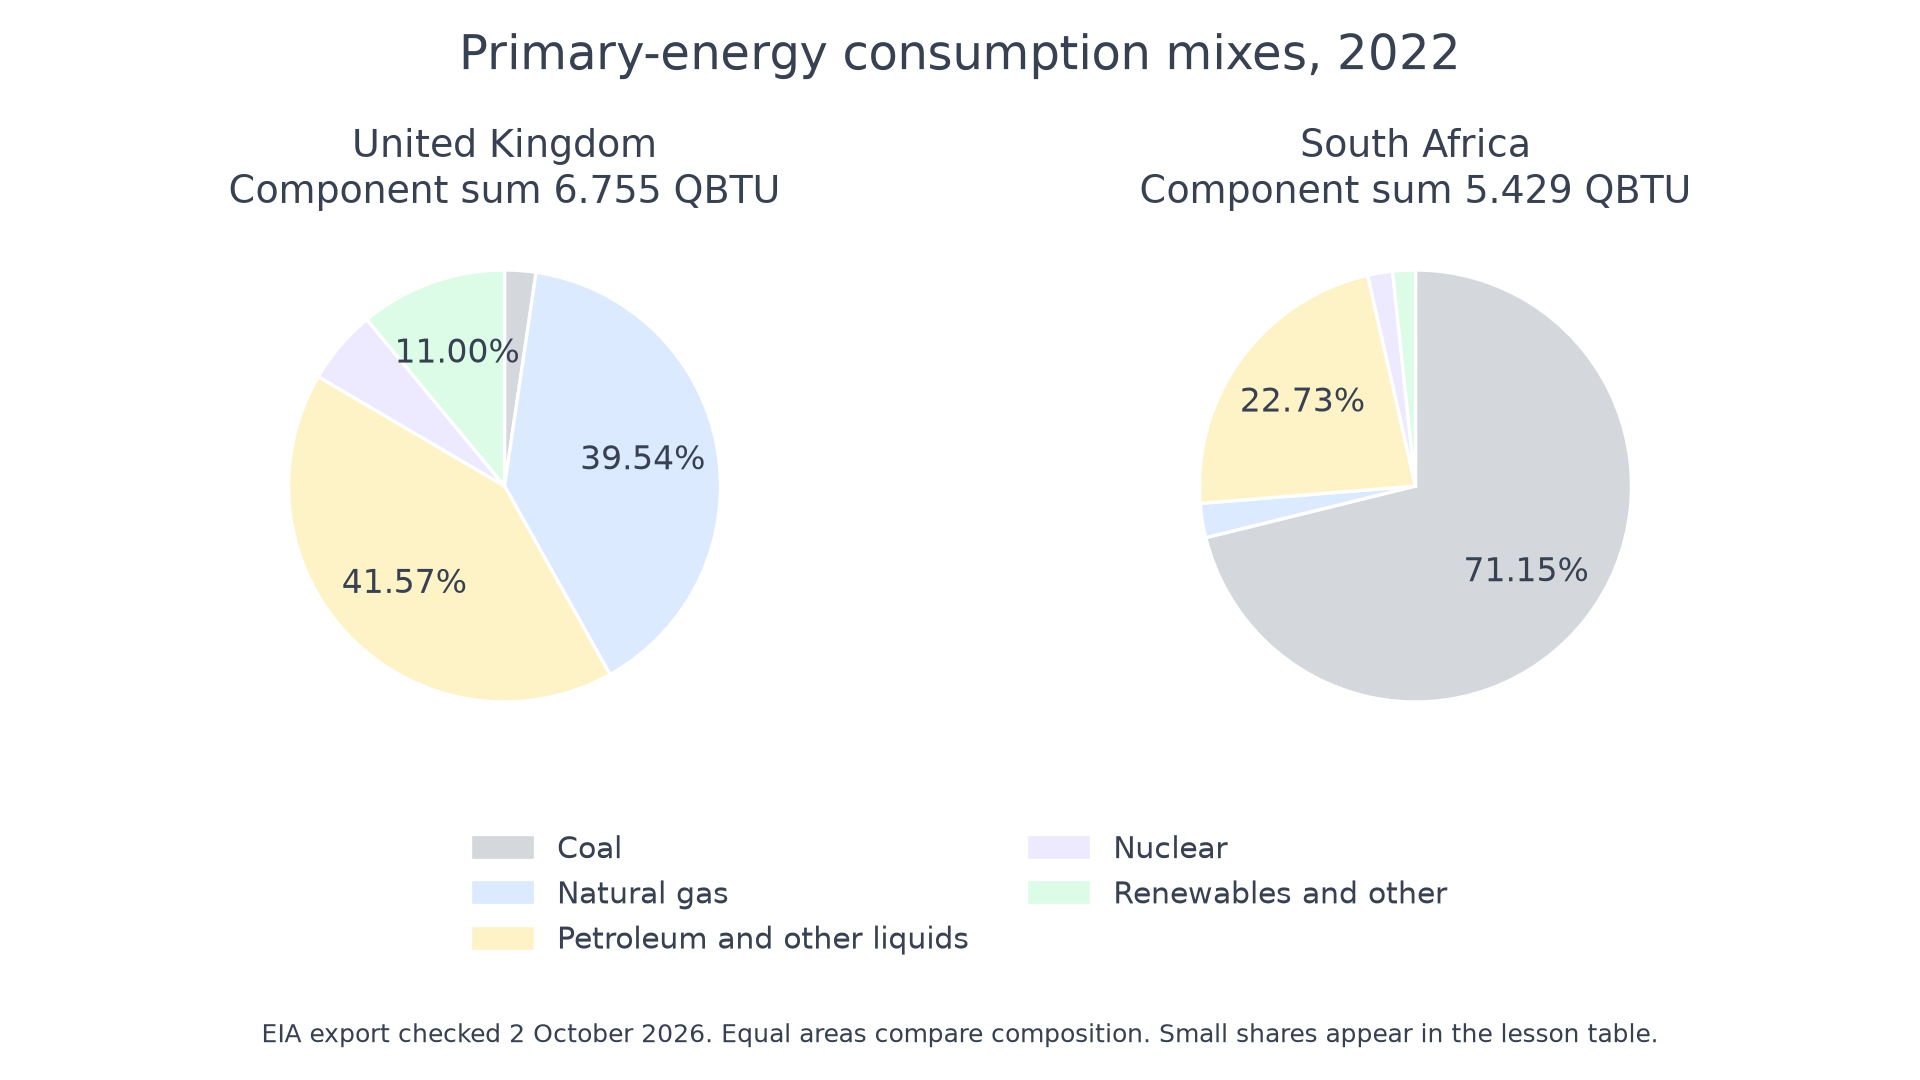
Original plot of the frozen EIA export. Equal circle size compares composition; it does not encode each country's total consumption.
Shares are each component divided by the sum of the five reported components: UK 6.755 and South Africa 5.429 QBTU. EIA's published UK total is 6.756, a 0.001 QBTU difference from rounded components. The South African total matches its component sum. Do not invent an extra category to remove the residual. Independently rounded South African shares sum to 99.99%.
Continue this lesson.
You’re previewing NovaLearn without an account. Create a free account to read the rest.
Create free account