3.2.1.3 - Trade patterns and access to markets
Learn how trade and investment vary over time and between places, why economies have different access to markets, and how those differences affect well-being. Compare evidence on a consistent basis rather than treating export totals as a measure of everyone's prosperity.
Trade and investment trends
Trade and investment connect economies in different ways, so their trends require different measures.
International trade exchanges goods and services across borders. Exports leave an economy; imports enter it. Investment flows finance assets or businesses, whereas investment stock is the accumulated value held at a particular date. A year's FDI inflow is not the same as the total foreign-owned investment already present.
Trade value is measured in money and changes with prices and exchange rates. Trade volume seeks to remove price changes and describe the quantity traded. More valuable exports do not necessarily mean more physical goods moved. WTO estimates published in April 2025 show world merchandise trade volume falling by 1.0% in 2023 and growing by 2.9% in 2024. In 2024 merchandise export value rose by 2%. The two measures describe different changes. WTO, Global Trade Outlook and Statistics, April 2025, pp2–6.
Costs, income, supply chains and market rules can support expansion; recessions, disruption or uncertainty can interrupt it. One year's recovery is not proof that trade grows every year. Annual data can hide sharp changes within the year and differences among sectors.
UNCTAD reported global FDI of about US$1.5 trillion in 2024, 4% above 2023, but found an 11% decline when volatile flows through financial conduit economies were excluded. A conduit economy channels investment onwards, so recorded inflows need not represent equivalent new productive capacity there. The contrasting figures use different coverage, not conflicting arithmetic. UNCTAD, World Investment Report 2025, chapter I key findings.
Large economies and spatial patterns
Large economies are major trading centres, but their roles differ by product, service and partner.
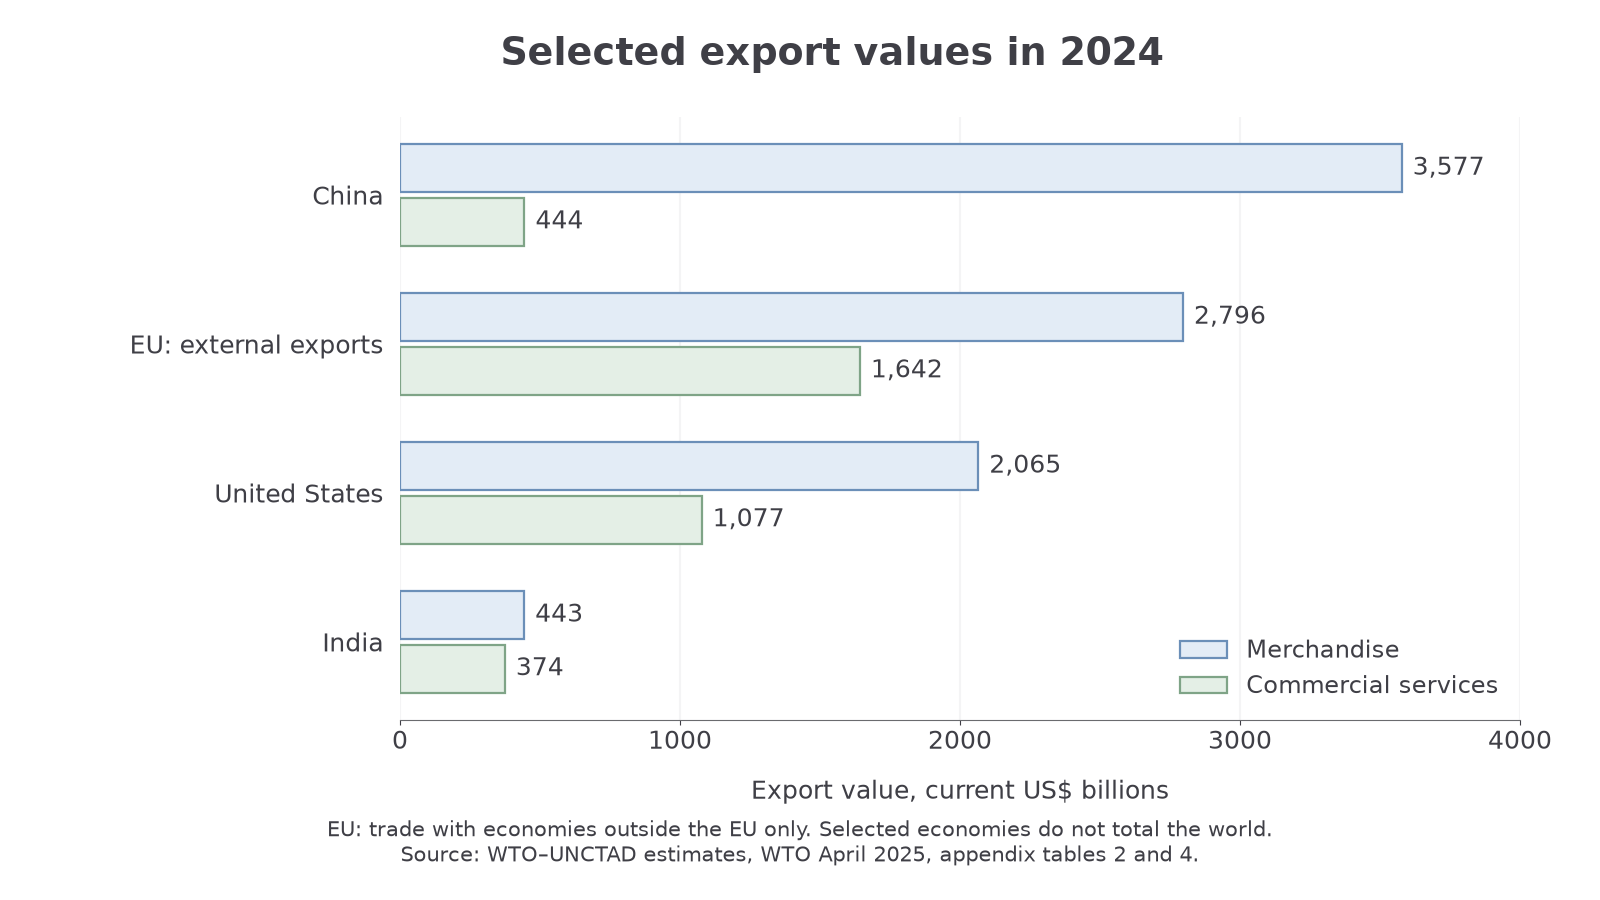
The bars show selected export values in current US$ billions. EU values cover trade with economies outside the EU, avoiding the inclusion of member-to-member trade in the EU aggregate. Source: WTO–UNCTAD estimates in WTO April 2025, appendix tables 2 and 4. These selected economies do not add up to the world, and exports are not GDP or profit.
China's goods exports greatly exceed its service exports. India has a much smaller goods total, with service exports closer to its goods total. The US and the EU are large service exporters as well as goods traders. These are sectoral contrasts, not a simple division into countries that produce and countries that consume. Large economies export and import simultaneously because they need different products, components and services.
Relationships involve both competition and complementarity. A manufacturer's exported component can become another country's input. Consumer demand and specialist services in highly developed economies connect with production and growing markets in emerging economies. Neither China nor India is representative of all emerging economies, and their internal regional inequalities matter.
FDI is also spatially concentrated. UNCTAD found that ten recipients accounted for about three-quarters of developing-country FDI inflows in 2024. Large markets, infrastructure, skills and established suppliers can attract additional investment, reinforcing concentration. Other places may specialise in a resource, a low-cost production stage or a strategic location. A foreign-investment total alone does not reveal whether local suppliers or workers benefit.
Contrasting smaller-economy relationships
Smaller, less-developed economies participate in varied regional and distant networks rather than sharing one uniform trade pattern.
In Kenya, a sub-Saharan African economy, reported 2023 merchandise exports reached several kinds of partner. Uganda received 12.53%, Pakistan 7.87% and the Netherlands 7.60%; China supplied 17.61% of Kenya's reported imports. The leading exported products included black tea and cut flowers. Regional demand, distant consumer markets and emerging-economy suppliers therefore coexist. World Bank WITS, Kenya trade summary 2023.
In Honduras, in Latin America, the US received 45.03% of reported merchandise exports in 2023, while El Salvador received 6.47%. This illustrates a more concentrated relationship with one large developed market alongside regional connections. A fall in US demand could therefore affect many exporters, although the effect depends on which goods and firms are involved. World Bank WITS, Honduras trade summary 2023.
In Bangladesh, in southern Asia, access to the EU links garment production with distant consumers. The European Commission recorded €19 billion of Bangladeshi exports using its Everything But Arms preferences in 2024. This is the value using a preference, not all Bangladesh exports or the share of workers who benefit. European Commission, EU–Bangladesh trade.
Compare these relationships using the same variable and period when possible. A partner's share of one country's exports differs from that partner's share of world trade. Small absolute flows can be vital to a small economy. WITS reports national customs data without filling every gap; a missing or revised record is not automatically a real absence or collapse of trade.
Development and practical market access
Permission to enter a market is useful only if a producer can deliver what buyers require at a viable cost.
Market access
The conditions under which a supplier can sell in a market, including border rules, standards, infrastructure, finance and commercial relationships.
Lower-income producers may face high transport costs, unreliable power, limited credit and insufficient testing or storage facilities. These raise delivered costs or prevent reliable supply. Wealthier firms can often spread certification and marketing costs over larger sales, employ specialist staff and absorb delayed payment. Development level influences these capabilities; it does not make every firm within a country equally capable.
Non-tariff barriers are restrictions or requirements other than import taxes, such as quotas, documentation or product standards. Some requirements protect health and consumers and are not necessarily designed to exclude poorer exporters. Their compliance costs can nevertheless be proportionally heavier for small firms. A cold-storage requirement, for example, can protect food quality while excluding a supplier that cannot finance refrigeration.
For an original illustrative comparison, suppose two growers receive permission to export fresh produce. One has reliable refrigeration and bank credit; the other has neither. Removing a tariff benefits both in principle, but the second may still lose shipments or fail delivery conditions. Practical access combines rules with productive and logistical capacity.
Agreements and preferential access
Trade arrangements change relative access by granting some suppliers more favourable conditions than others.
A free-trade area reduces selected barriers between members, while members retain their own external tariff policies. A customs union also uses a common external tariff policy. Agreements may cover goods, services or other rules to different extents; membership does not mean unrestricted trade in everything.
Rules of origin determine whether goods qualify as originating in a place for a particular treatment. They can prevent goods being routed through a member merely to claim a preference, but documentation and input rules can add costs. A zero preferential tariff is not helpful if a producer cannot meet the applicable origin conditions. WTO explanation of preferential rules of origin.
The EU's Everything But Arms (EBA) arrangement is a unilateral preference for least-developed countries, not a reciprocal free-trade agreement. For the dated Bangladesh example above, it provided duty-free, quota-free access except for arms and ammunition. Preferences can make qualifying exports more competitive, yet standards and practical delivery constraints remain. Status and conditions can change, so do not treat the 2024 example as a permanent entitlement for a future year.
Trade creation occurs when lower barriers encourage purchases from a more efficient supplier. Trade diversion occurs when a preference shifts purchases away from an otherwise cheaper non-member supplier. A preferential arrangement can therefore help some places while disadvantaging excluded competitors. Actual effects depend on the product, previous barriers and suppliers' capacity, not simply the presence of an agreement.
Well-being and evidence across scales
Trade access can improve well-being, but national export growth does not establish how gains and costs are shared.
Access to larger markets can increase orders, employment and foreign-currency earnings. Imports may widen choice, lower costs or supply essential machinery and medicines. Export expansion can also expose workers to changing foreign demand, displace competing local producers or increase environmental pressure. Economic well-being concerns material resources and security; societal well-being also includes health, rights, participation and relationships.
Trace a mechanism across scales: an overseas buyer increases orders; a factory hires workers; households gain income; the state may receive tax revenue. Each link is conditional. Imported inputs and profits sent abroad reduce income retained locally, wages and job security affect households, and tax receipts improve public services only if they are collected and used effectively. Consumer benefits in an importing country can coexist with pollution or unsafe work elsewhere.
To investigate a claim using an electronic database, select the reporter, partner, year, flow, product classification and unit before downloading. For Kenya's 2023 exports to Uganda, the partner share is 12.53% of Kenya's exports, not 12.53% of Uganda's imports. Keep reporter data and partner-reported data distinct. Do not add an EU aggregate to its member countries or combine overlapping regions.
For a proportional bar or flow diagram, use a common scale and state the denominator. Bar length represents value, not physical quantity. If using circles, area rather than radius must be proportional to the value. Calculate shares with the same coverage:
For original illustrative figures of US$15 million exported to one partner out of US$60 million total exports, the share is 25%. If the total later rises to US$100 million while that partner still receives US$15 million, its share falls to 15% despite an unchanged absolute flow.
Combine those quantities with evidence about lived experience. Interviews with workers or residents can explain security, rights or local environmental costs that customs records cannot measure. A small interview sample may reveal a mechanism without representing every household. Compare perspectives, date the evidence and distinguish measured outcomes from predictions about what trade might cause.