3.2.5.7 - Physical environment and resource use in a place
Use a complete Dubai water case to connect physical conditions, engineered availability, cost and use, then adapt the enquiry to your actual home or study-centre place using genuine evidence.
Dubai physical setting and supply
Dubai's coastal urban mainland illustrates how abundant seawater can coexist with constrained usable freshwater.
The place is Dubai emirate, with physical examples located in its coastal urban mainland. DEWA figures describe its emirate service/operations aggregate, not a sampled household or every neighbourhood's conditions. Inland Hatta has a different physical setting and must not be silently substituted for coastal Dubai.
A hot arid climate gives limited and variable rainfall, high evaporative demand and irrigation/cooling pressures. Groundwater recharge is constrained and water may be saline; presence of an aquifer does not establish a large sustainable potable yield. Coastal access supplies seawater, but salt removal requires treatment before drinking-water use. Networks and storage then deliver water inland and across the urban area. Dubai government geography.
Occasional intense rain does not remove long-term supply constraints: it can produce rapid runoff rather than reliable recharge. The Dubai Statistics rainfall table gives 71.5 mm in 2022, 149.2 in 2023 and 299.75 in 2024. Its “Dubai” station/aggregation detail is unstated, and three annual figures are not a climatic normal or a city-wide field survey. Published rainfall table.
Supply, use and capacity evidence
Annual production and installed capacity describe different aspects of Dubai's engineered supply.
DEWA's 2025 Sustainability Report, primary indexed tables pp 21/57, gives annual desalinated production in MIG (million imperial gallons) and installed capacity in MIGD (million imperial gallons/day). The table is inspected; direct PDF access returned 403, so this case does not claim full-report inspection. Primary report reference.
| Year | Annual production, MIG | Installed capacity, MIGD |
|---|---|---|
| 2021 | 126,147 | 490 |
| 2022 | 136,254 | 490 |
| 2023 | 143,309 | 495 |
| 2024 | 150,478 | 495 |
| 2025 | 158,359 | 495 |
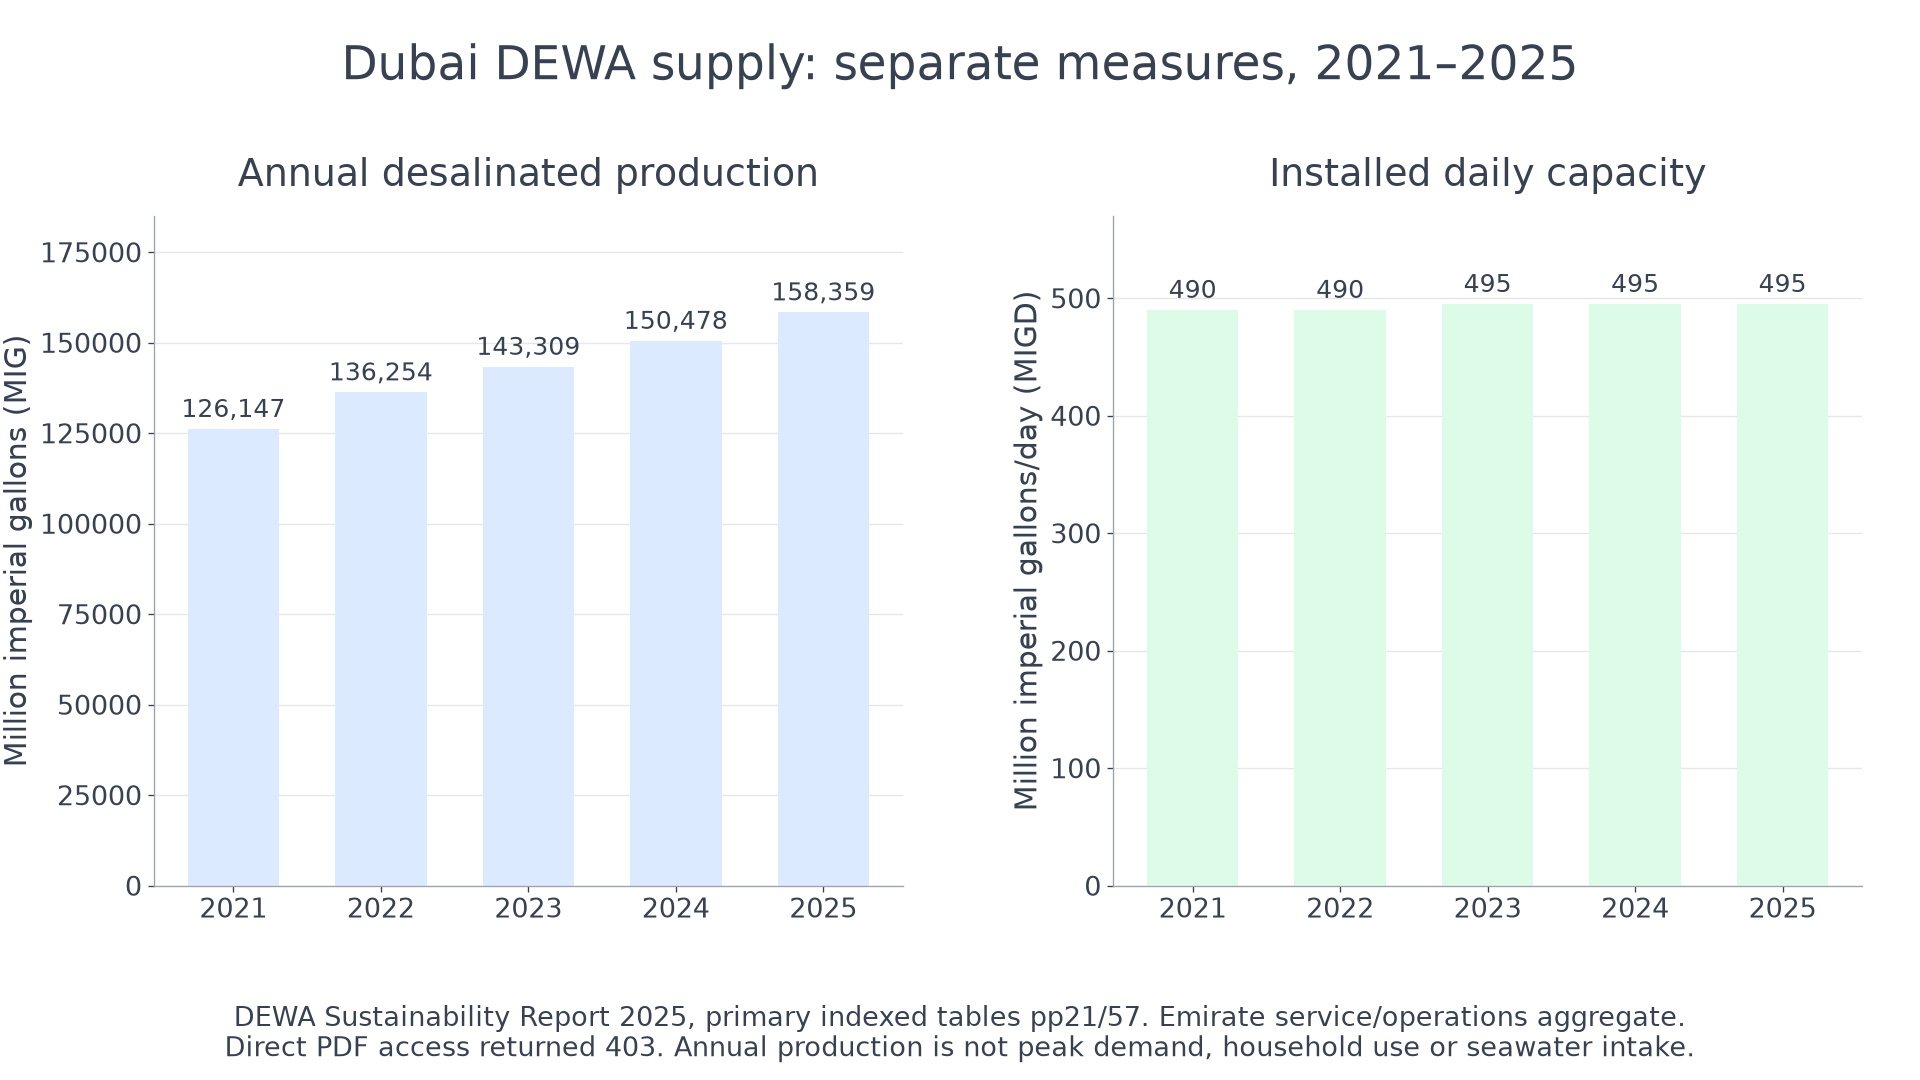
Original plot of the primary indexed table. Annual production is output, not household consumption, seawater intake or peak daily demand.
Growth from 2024 to 2025 is . Mean 2025 output is MIG/day. Its comparison with 495 MIGD gives of nameplate capacity on an annual-average basis. It does not prove reliable supply at peak demand or during maintenance.
One imperial gallon is 4.54609 litres, so 158,359 MIG equals 719.91 million m³. The reporting unit must not be confused with US gallons. Domestic use, services, industry and landscaping create demand; aggregate production trends cannot establish which user's behaviour caused them. In March 2025 DEWA changed billing units to m³, while this annual supply table retains MIG/MIGD. DEWA unit change.
Physical costs and charged prices
The physical burden of providing water and the amount charged to a customer are related but different measures.
Continue this lesson.
You’re previewing NovaLearn without an account. Create a free account to read the rest.
Create free account