3.2.4.7 - Population change in a country or society
Use Japan as a coherent country study: describe change in numbers and structure, explain environmental and socio-economic relationships, and assess implications through dated census evidence and conditional future projections.
Japan's changing numbers and age structure
Japan combines national population decline with continued concentration in particular places. Distinguishing total change, natural change and migration makes the pattern intelligible.
The final 2025 census summary, released 29 September 2026, records 122,972,528 residents on 1 October 2025, compared with 126,146,099 in 2020: a fall of 3,173,571, or approximately 2.5% over five years. This is an observed census interval, not a forecast or annual birth rate.
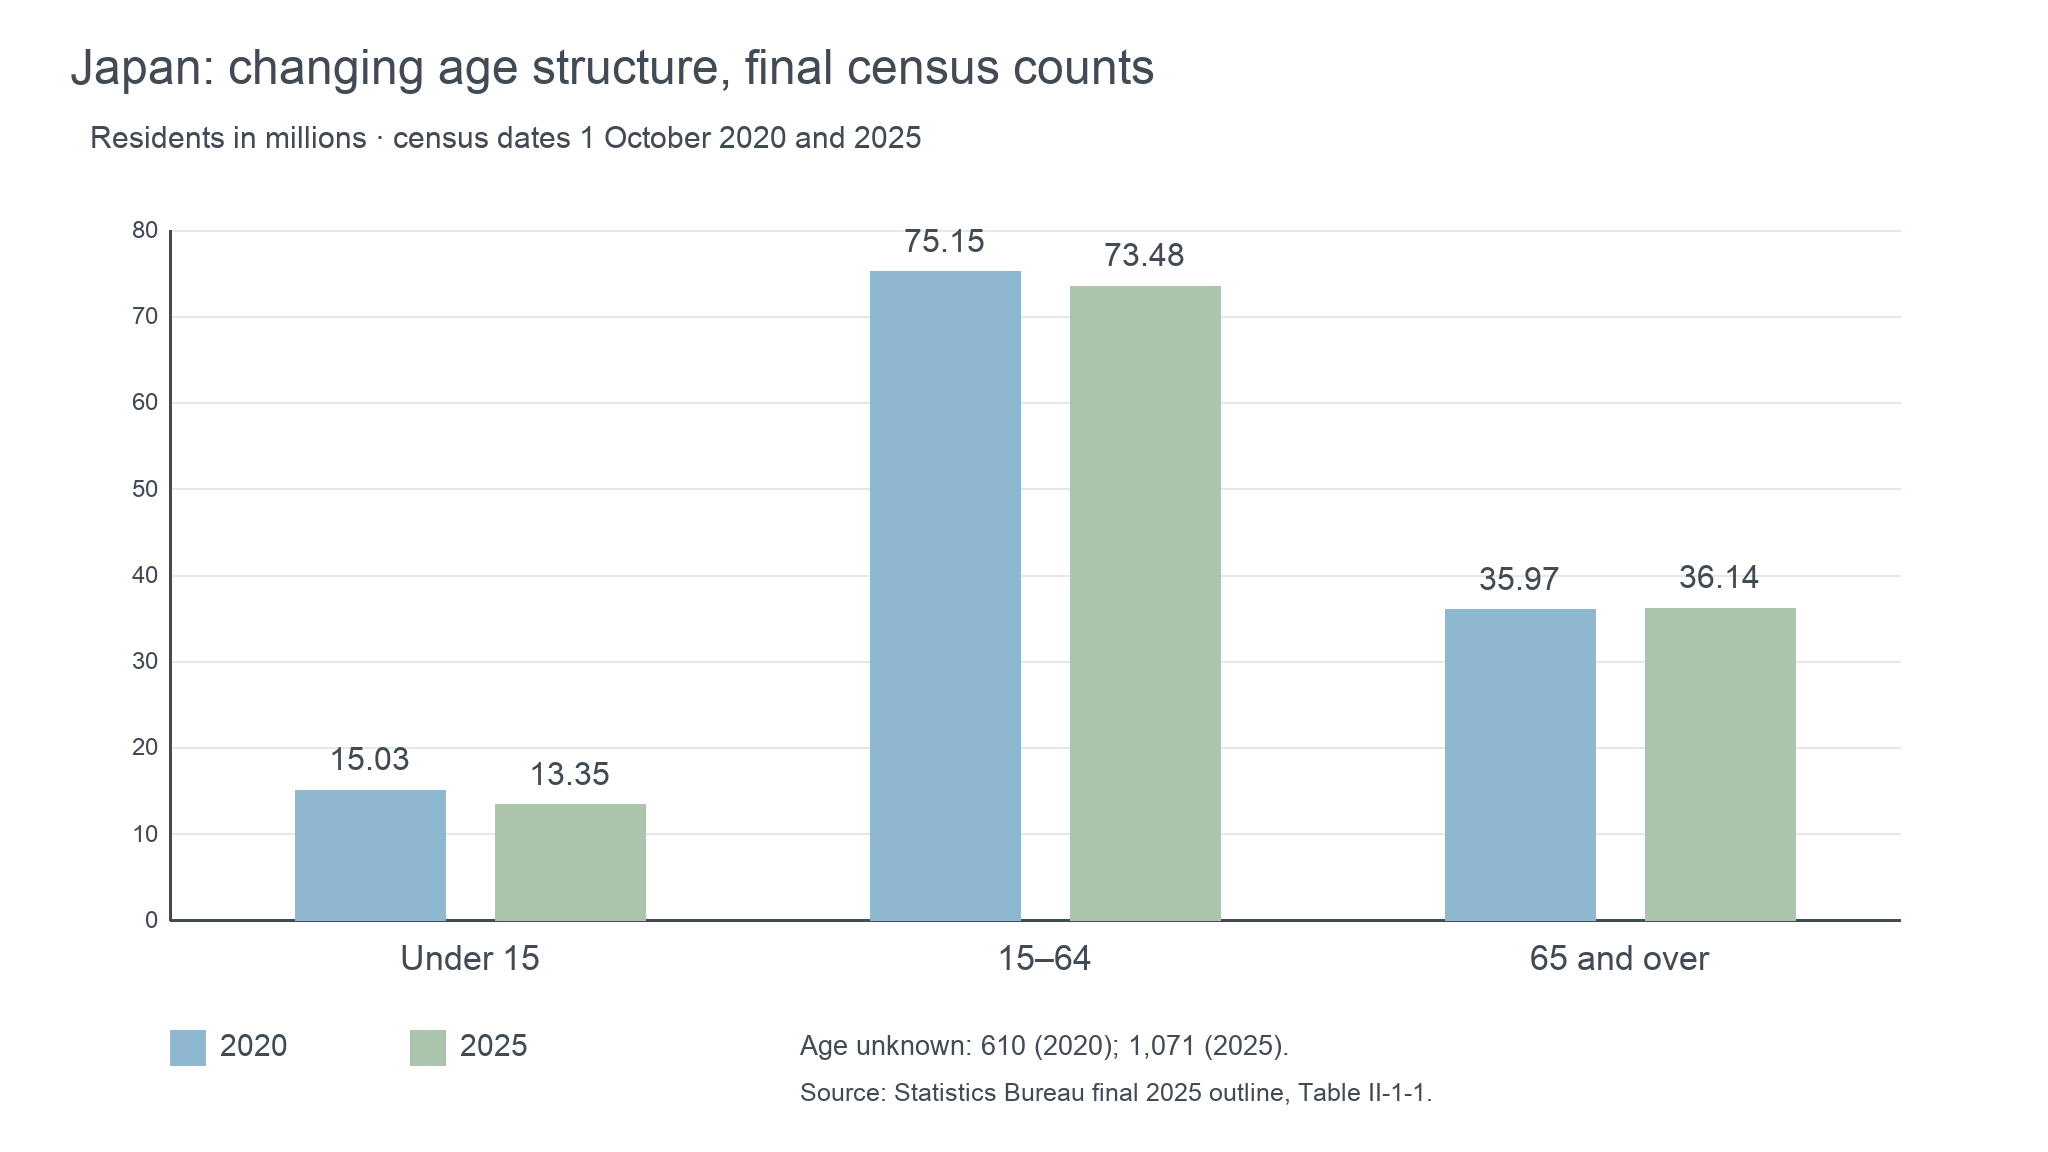
The matching final census age table uses imputed age results for comparison. Under-15 numbers fell from 15,027,298 to 13,349,001, while people aged 65+ increased slightly from 35,968,868 to 36,141,613. The 2025 published shares are 10.9% under 15, 59.8% aged 15–64 and 29.4% aged 65+, which total 100.1% because of rounding. Residual unknown ages are 610 in the comparison for 2020 and 1,071 in 2025; do not combine these results with an older unadjusted age denominator.
A growing older share need not mean rapid growth in older numbers. Here, falling child and working-age numbers also raise the relative older share. The 2025 age dependency ratio from counts is approximately (13.349 + 36.142) ÷ 73.481 × 100 = 67.4 per 100 aged 15–64. It indicates age composition, not actual employment or the number of people receiving care.
Environment and spatial concentration
Physical geography helps explain settlement opportunities, while employment and connections explain why populations concentrate within them.
Japan's mountainous interior restricts extensive flat land for settlement and farming. Coastal plains and transport corridors offer more accessible development locations, supporting concentrations of housing, industry and services. This is a relationship between opportunities and human investment, not a rule that all coastal land is equally safe or prosperous.
The Statistical Handbook of Japan 2026 records that the Kanto, Kinki and Chukyo major metropolitan areas contained 52.6% of the population in 2020. These metropolitan definitions include central cities and surrounding municipalities; they are not the same geographical unit as Tokyo Metropolis. The handbook's historical spatial evidence is separate from the final 2025 census.
Concentration offers transport and service efficiencies, but also exposes many people and assets to hazards. Low-lying urban areas can face flooding, and typhoons bring storm and flood damage. An older population may have greater evacuation or heat-care needs, so risk depends on accessible warnings, housing and support as well as hazard magnitude. A population decline does not automatically remove the risk to those remaining.
Depopulation in remote settlements can make maintenance of transport, farmland and local services more difficult. Land abandonment may permit vegetation recovery, but neglected infrastructure can create new problems. Meanwhile, metropolitan concentration can maintain development pressure. National decline therefore cannot establish a uniform reduction in environmental demand.
Vital rates, migration and socio-economic change
Japan's change reflects low fertility, ageing and selective movement; a national total alone cannot identify each contribution.
The 2026 handbook's vital statistics report 2024 birth and death rates of 5.7 and 13.3 per 1,000, respectively, giving natural decrease of 7.6 per 1,000 in that series. Total fertility was 1.15 children per woman. These dated vital-statistics measures are distinct from the all-resident 2025 census count; do not reconstruct census population change by applying one year's rate to a five-year interval.
Continue this lesson.
You’re previewing NovaLearn without an account. Create a free account to read the rest.
Create free account