3.1.3.6 - Local coastal processes and sustainable management
Use Holderness–Spurn as a complete provider-local worked example, focusing on measured retreat near Mappleton and Cowden. Learn how to adapt its investigation design to a coast accessible from your own home or study centre.
Holderness–Spurn: a connected landscape
Holderness on England's east coast links eroding cliffs, beaches and the Spurn spit near the Humber mouth through sediment transfers. Its wider sediment-cell setting is Cell 2, while East Riding's monitoring programme uses subcell 2a; these labels are distinct from the numbering of SMP3.
The coast's unconsolidated glacial deposits can fail through interaction between saturation, slope structure and marine removal. BGS's Aldbrough case describes Skipsea and Withernsea tills with differing properties and stepped cliff forms. This nearby geological evidence supports a regional mechanism; it does not identify the exact layer at every Mappleton survey point. Waves attack the foot, slope material fails and removal of debris permits renewed retreat. A beach covering the foot can temporarily change that attack.
Sediment is sorted after release. Sand and gravel can enter beach stores and net southward transport towards Spurn, while fines can remain suspended and follow other offshore or estuarine pathways. Spurn's sand/shingle ridge, dunes and sheltered estuarine features form a connected landscape. They are not made from every eroded cliff particle. Tidal currents near the Humber and changing wave directions influence the spit and its inlet relationship.
JNCC's 2003 account records competing interpretations of Spurn's long history, including cyclic development and human influences. Do not treat a 250-year destruction cycle as established law. ERYC's current table dates the loss of the Spurn neck to December 2013; that is a particular event, not proof of a universal cycle or a statement that the whole spit disappeared.
The worked local question is: How does measured cliff recession vary across the Mappleton–Cowden frontage, and what can that evidence support about sustainable management? Define this frontage rather than treating four profiles as a representative sample of all Holderness. The larger system supplies context; the local measurements answer a narrower question.
Reading the Mappleton–Cowden measurements
ERYC's table updated in June 2026 supplies professional observations through March 2026, with short-interval losses and differently dated average rates.
| Profile and position | March–September 2025 loss (m) | September 2025–March 2026 loss (m) | 1852–1989 average (m/year) | 1989–March 2026 average (m/year) |
|---|---|---|---|---|
| 51, north of Mappleton defences | 0.00 | 0.00 | 1.56 | 0.19 |
| 52, south of Mappleton defences | 2.20 | 1.04 | 1.54 | 1.95 |
| 53, between Mappleton and Cowden | 0.00 | 4.07 | 1.58 | 3.28 |
| 54, north of Ellmere Lane, Cowden | 0.00 | 6.38 | 1.50 | 3.21 |
Source: ERYC coastal erosion statistics, PDF p1, profiles 51–54, June 2026 update. Loss is horizontal cliff recession along the survey profile, not beach elevation or sediment volume.
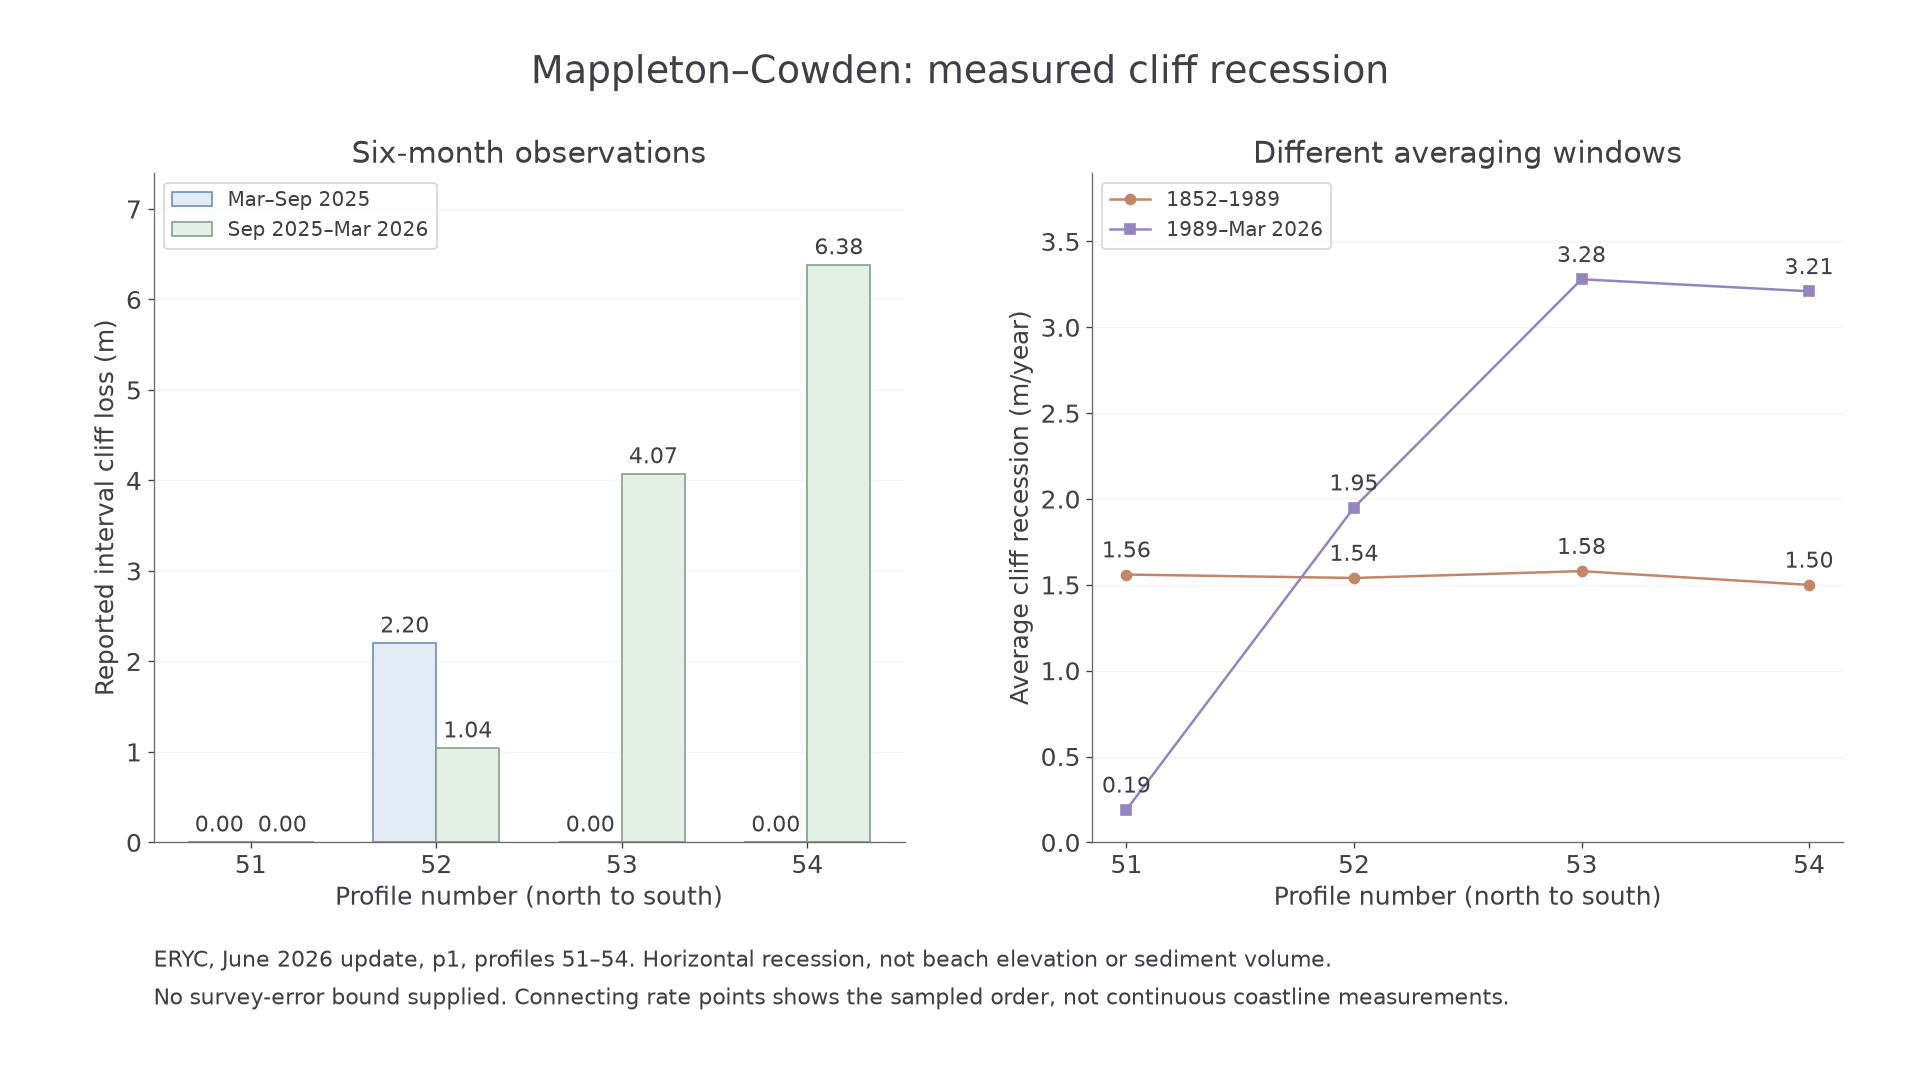
The two panels keep interval losses in metres separate from average rates in m/year. No unreported survey error bars are invented.
Adding the two intervals gives reported March 2025–March 2026 losses of 0.00, 3.24, 4.07 and 6.38 m. Profile 52 is the only one of these four with a non-zero reported loss in both intervals; profiles 53 and 54 have loss concentrated in the second. Recent average rates exceed the historic averages at 52–54 but are lower at 51. At 53, the difference is m/year; this compares two averaging windows, not acceleration measured in every year.
The table's OS coordinate pairs locate survey lines; they are not cliff-edge positions. Use their British National Grid reference when mapping them. A reported 0.00 means no recession recorded at that profile/interval, not that all coastal processes stopped. Reporting to 0.01 m does not establish accuracy to 0.01 m: the source supplies no such error bound. Neighbouring profiles share conditions and are not independent replications. The spatial contrast is compatible with defence, exposure and geological effects, but cannot assign a causal share to groynes without a stronger design.
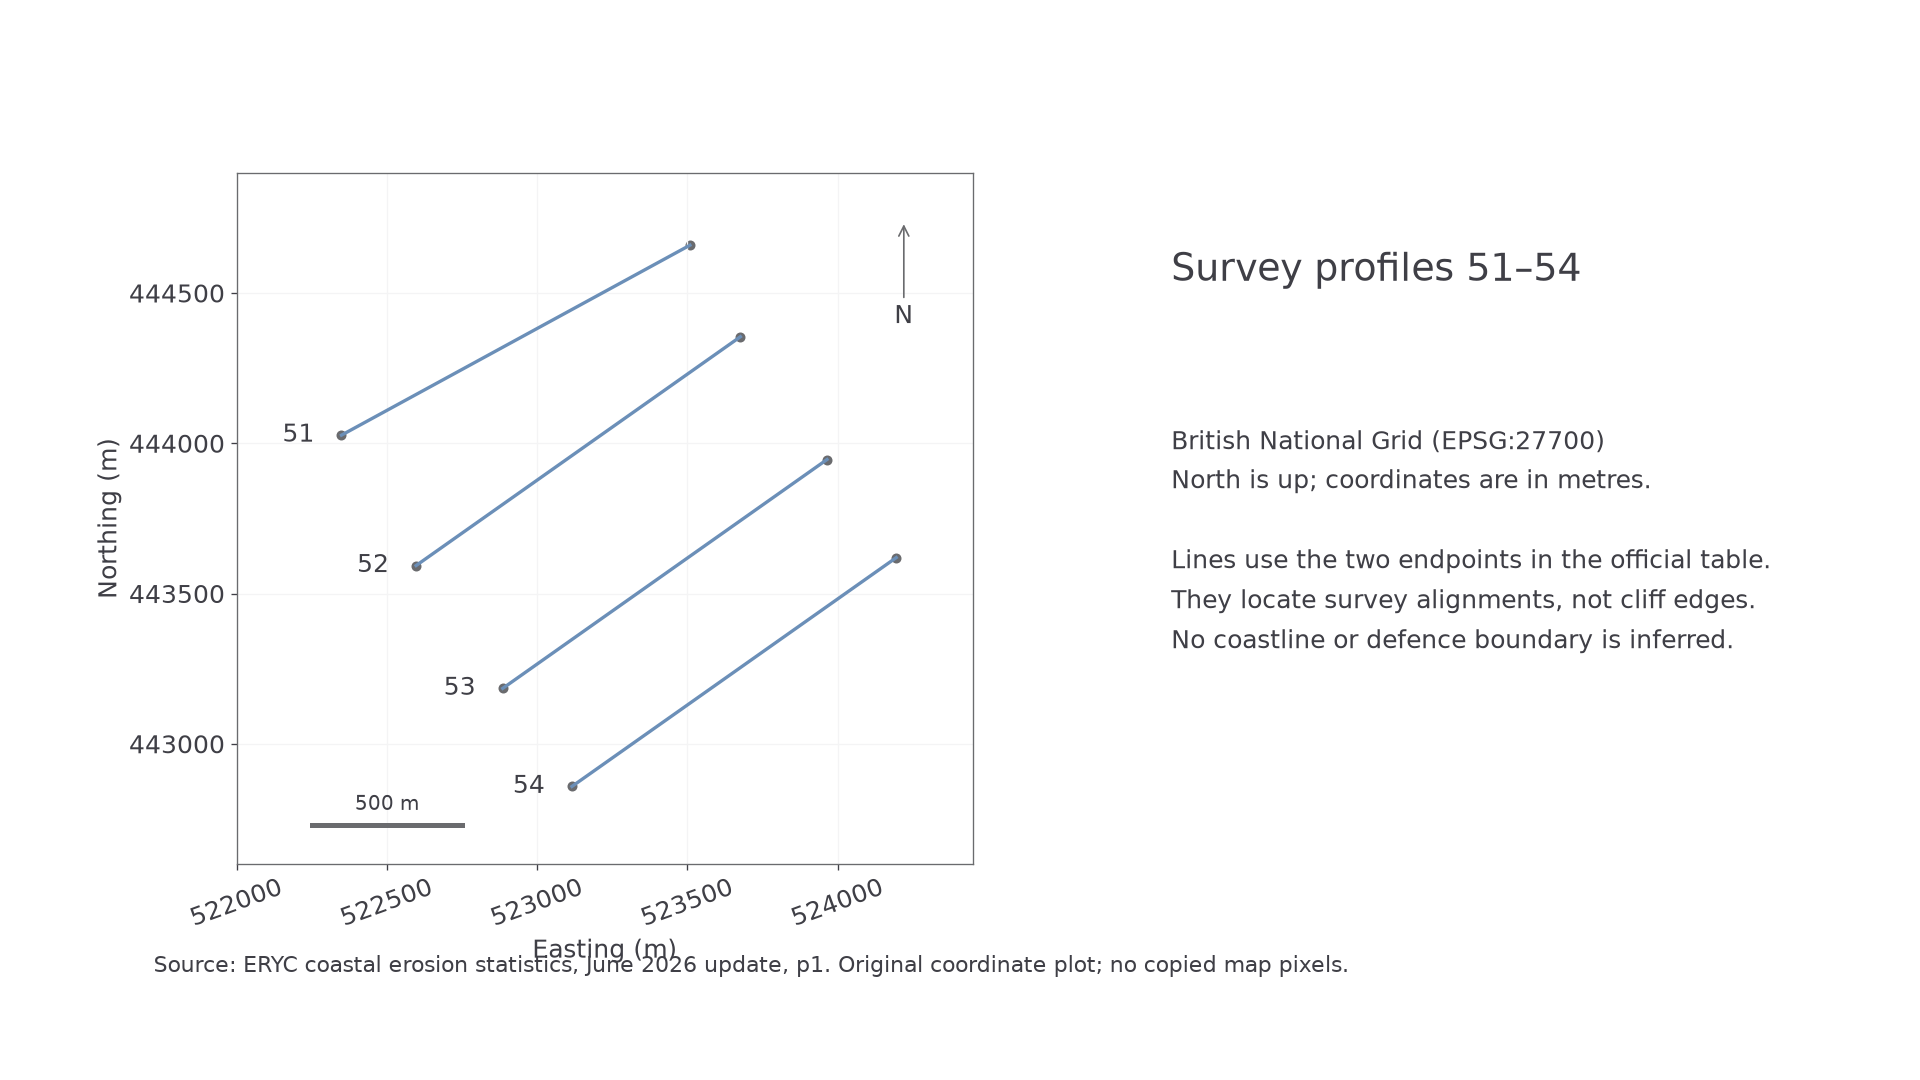
This exact coordinate plot has north, scale and units. It deliberately makes no claim that endpoints trace a cliff edge.
Continue this lesson.
You’re previewing NovaLearn without an account. Create a free account to read the rest.
Create free account