3.4 1.a, 1.b - Food security, global patterns and food systems
Food security depends on whether people can obtain and use suitable food, not simply on how much a country produces. This lesson explains access, availability and use, interprets dated global indicators, and shows how physical growing conditions connect to production, processing, transport, consumption and waste.
Access, availability and use
Food security exists when people can reliably obtain sufficient, safe and nutritious food for a healthy life.
Three interacting pillars explain food security. Availability concerns the supply of food through production, stocks, imports and assistance. Access concerns people's ability to obtain it, including income, prices, transport, rights to land and fair distribution. Use, also called utilisation, concerns dietary quality, food safety and the body's ability to benefit from food, supported by clean water, sanitation and health.
A good national harvest does not ensure access for a household with no income. Food bought cheaply may still provide an inadequate diet if it lacks essential nutrients. Even a varied diet may not produce good nutritional outcomes when disease or unsafe water impairs the body's use of it. The pillars interact, so increasing one input does not automatically remove every constraint.
FAO frameworks also explicitly include stability across time. A household that eats adequately after harvest but regularly runs short before the next harvest is not securely fed. Stability therefore concerns the reliability of availability, access and use. Wider frameworks additionally discuss people's agency in food decisions and the sustainability of supply. FAO's basic concepts guide.
Patterns and trends in food security
Different indicators measure different aspects of food security and must be compared with their definitions and dates intact.
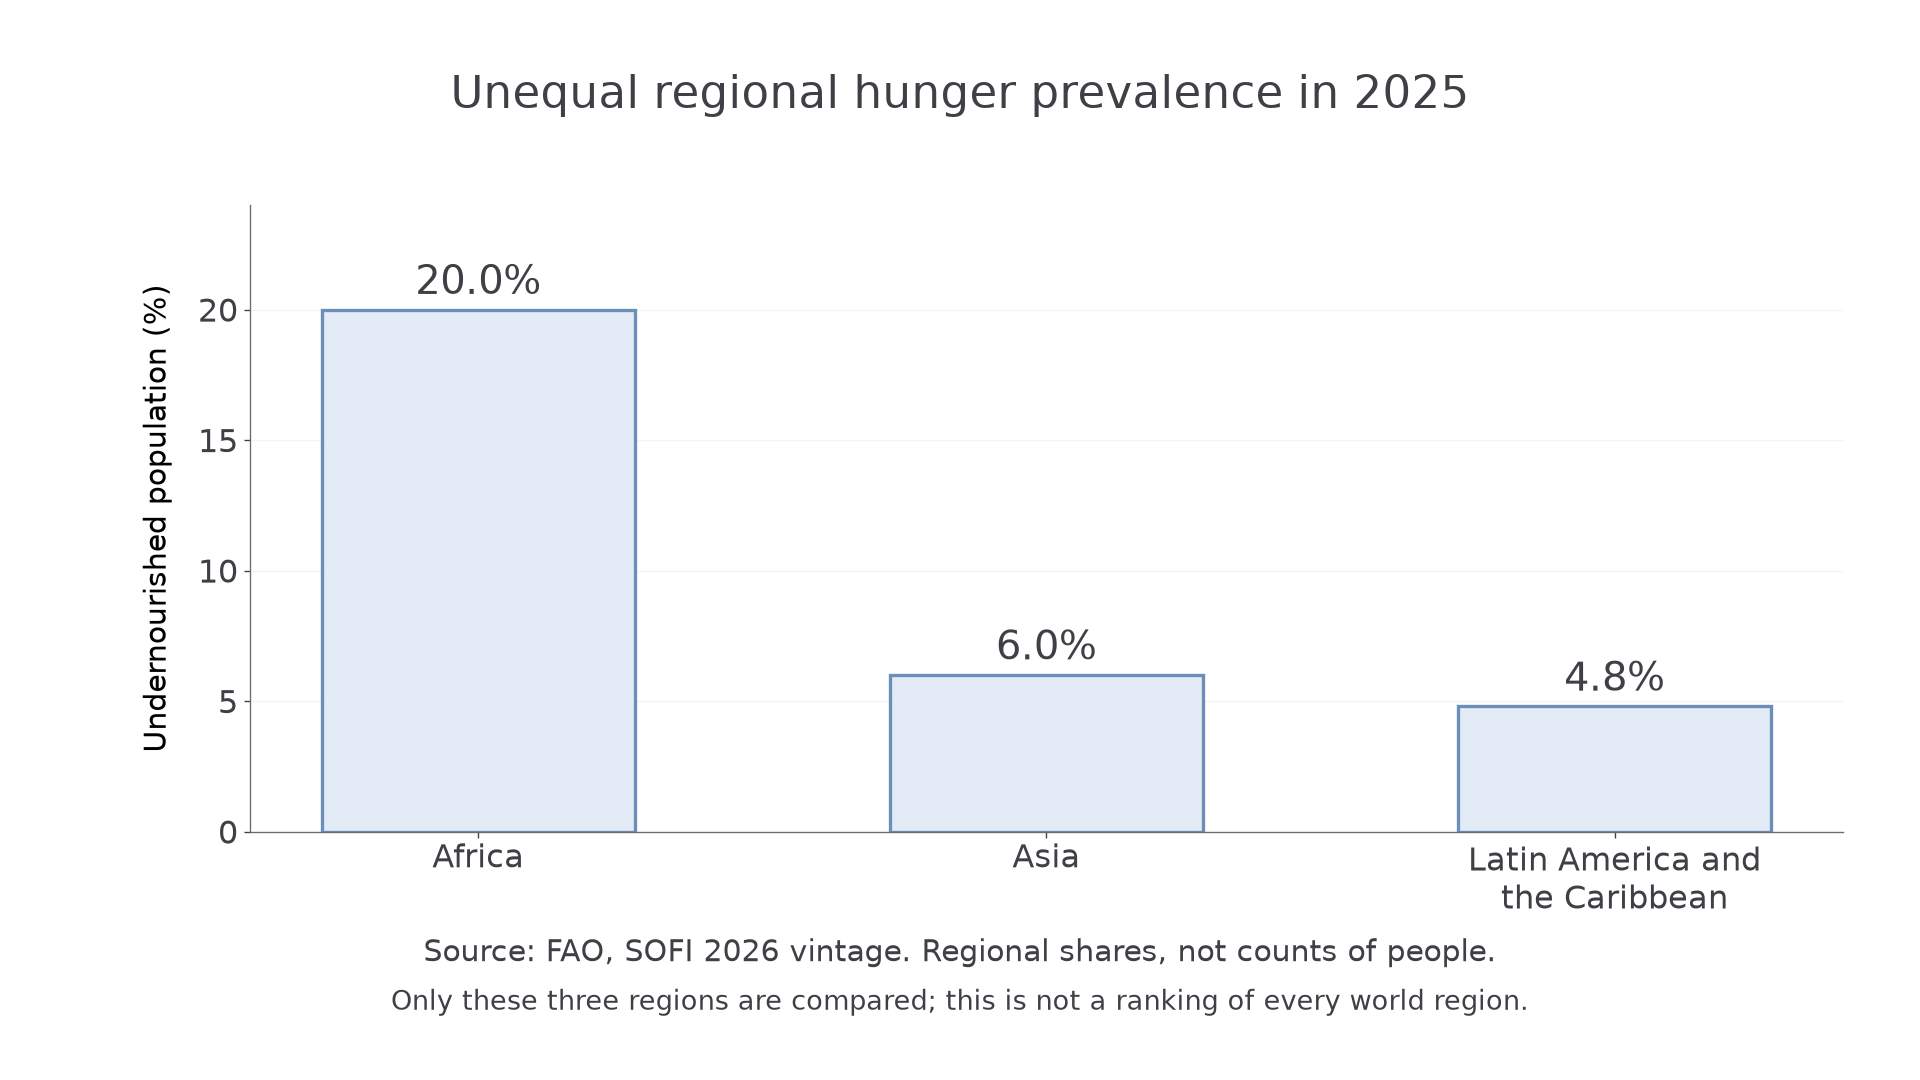
FAO's State of Food Security and Nutrition in the World 2026 estimates that about 645 million people, or 7.8% of the world population, faced hunger in 2025. Its global estimate is lower than in 2024, but improvement is uneven. The report estimates 309 million undernourished people in Africa and 292 million in Asia in 2025. Africa's prevalence was 20.0%, compared with 6.0% in Asia and 4.8% in Latin America and the Caribbean. Population size affects totals, so a total and a prevalence answer different questions. FAO's 2026 hunger statistics.
[DIAGRAM: asset_name: Regional hunger prevalence; asset_slug: h481_d25_hunger; caption: SOFI 2026 estimates show unequal hunger prevalence in 2025.; description: A bar chart compares estimated undernourishment prevalence in 2025: Africa 20.0%, Asia 6.0%, Latin America and the Caribbean 4.8%. These are regional population shares from the SOFI 2026 vintage, not individual-country values, counts of acute crises or a ranking of every world region.]
The prevalence of undernourishment estimates insufficient habitual dietary energy. It does not count every form of poor diet. The 2026 report's broader moderate-or-severe food-insecurity measure affects about 2.1 billion people in 2025, reflecting compromised food access and experience. Do not add these overlapping populations together. Estimates can be revised when methods or inputs improve; trends should use one consistent release rather than combine unrevised figures from different reports. FAO's 2026 report summary.
The Global Food Security Index, or GFSI, is a different composite measure of national food-system conditions. Its 2022 edition covers 113 countries through affordability, availability, quality and safety, and sustainability and adaptation. Finland scored 83.7 out of 100 and the UK 78.8; these scores are not percentages of people who are food secure. The edition is historical evidence, not a newly released 2026 annual ranking. Weights, missing data and national aggregation influence results, while household inequalities remain hidden. Economist Impact, GFSI 2022 report.
Within every development category, income, gender, disability, location and conflict exposure can create unequal access. A national average or high index score therefore cannot establish that every household is secure.
Worked examples: percentage-point prevalence gaps
Example 1. Illustrative dataset: a consistent survey estimates severe food insecurity among 11.2% of a coastal district's households and 17.9% of an inland district's households.
The inland prevalence is 6.7 percentage points higher. Each share uses its own district's household total, so the result is a gap between proportions, rather than a difference in the number of food-insecure households.
Example 2. Illustrative dataset: two surveys using the same definition record household food insecurity falling from 28.6% to 21.4% in a farming region.
The household prevalence has fallen by 7.2 percentage points. The measure concerns households and cannot automatically be read as the share of individual children affected.
Continue this lesson.
You’re previewing NovaLearn without an account. Create a free account to read the rest.
Create free account