3.2 3.a - Malaria causes, impacts and responses in Nigeria
Nigeria's malaria burden results from interactions between parasites, vectors, environments and unequal access to protection and care. This country case explains those causes, distinguishes prevalence and incidence evidence, and evaluates the socio-economic effects and the direct and indirect strategies used to reduce them.
Environmental and human causes
Nigeria lies in West Africa, between the humid Gulf of Guinea coast and drier northern regions towards the Sahel. In OCR's terminology it is an emerging and developing country, but national averages conceal major differences in settlement, wealth, services and ecological conditions. A country-level case therefore needs a subnational explanation.
Malaria is caused by Plasmodium parasites, usually transmitted by infected female Anopheles mosquitoes. A mosquito acquires parasites when feeding on an infected person; after development within the vector, parasites can be passed during a later bite. Plasmodium falciparum dominates Nigeria's recorded indigenous malaria. Ordinary social contact does not provide this vector-mediated route. WHO Nigeria country profile, World Malaria Report 2025, published February 2026.
Warm conditions support vector and parasite development where suitable moisture and breeding habitats exist. Rainfall and standing water can increase habitats, while seasonality is stronger in drier northern settings. Humid conditions can support longer transmission seasons, but this does not mean the wettest region necessarily has the highest observed incidence. Vector species, population immunity, prevention and service access can outweigh a simple rainfall relationship.
Housing affects contact between people and vectors. Unscreened openings, poor-quality buildings and outdoor sleeping can increase exposure, while household resources influence access to usable nets and timely care. Irrigation, drains and construction can alter breeding water. Displacement and insecurity can disrupt prevention and services, especially when households move or cannot reach clinics. These pathways explain differences without portraying infection as an inevitable consequence of poverty or climate.
Repeated exposure can produce partial immunity, so some infected people have few symptoms while others, particularly young children or other vulnerable groups, face severe illness. This complicates measurement and control: clinic records miss infections that never reach a facility. WHO's Nigeria report published in 2023 describes spatially tailored responses rather than treating the country as one homogeneous risk zone. WHO Nigeria malaria report, 2023 publication of the 2022 country assessment.
Malaria incidence and prevalence
Nigeria's malaria evidence measures several different things. Household surveys test a defined group at a particular time, while routine systems count diagnosed episodes and models estimate a wider burden. Comparing them without their denominators, dates and methods creates false trends.
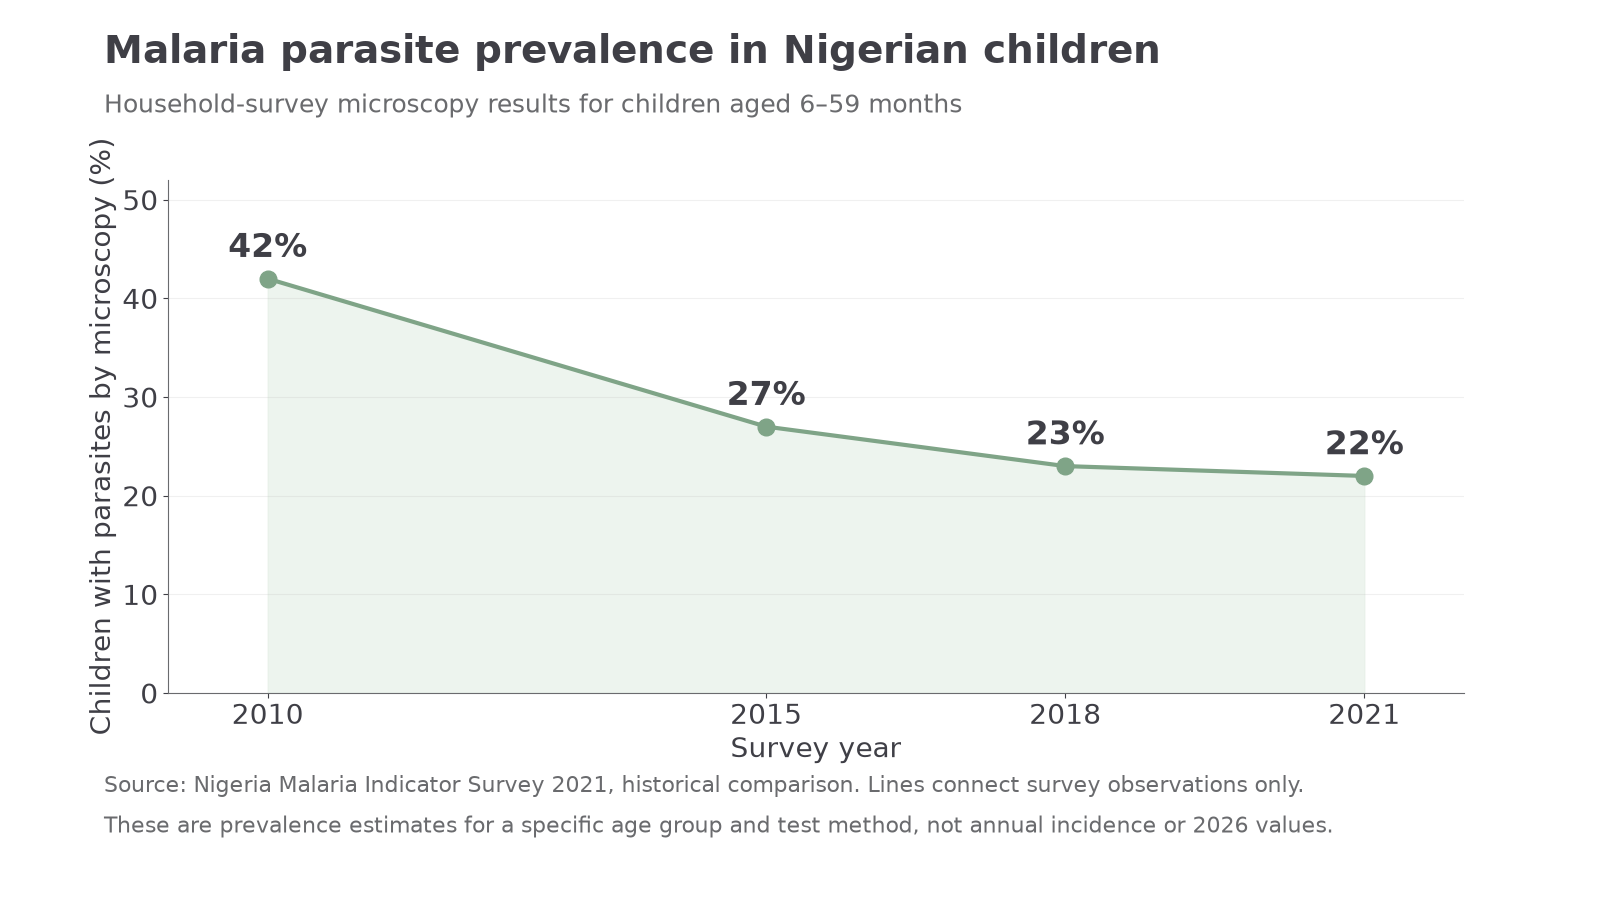
The 2021 Nigeria Malaria Indicator Survey tested children aged 6–59 months during October–December. Microscopy found parasites in 22% of that age group, compared with 42% in the 2010 survey. The corresponding national values were 27% in 2015 and 23% in 2018. These are dated survey prevalence estimates, not annual incidence rates for all Nigerians. Survey timing and test method matter: the 2021 rapid-test antigen result differed from microscopy, so the two cannot be spliced into one trend. Nigeria Malaria Indicator Survey 2021, Chapter 4.
[DIAGRAM: asset_name: Survey malaria prevalence among young children; asset_slug: d12-nigeria-prevalence; caption: Comparable microscopy estimates show lower malaria prevalence among Nigerian children aged 6–59 months between 2010 and 2021; description: Four labelled observations show 42% in 2010, 27% in 2015, 23% in 2018 and 22% in 2021. The diagram identifies household-survey prevalence, age group and microscopy method, and does not present these as annual incidence or current 2026 values.]
WHO's 2025 country profile lists about 22.7 million reported confirmed cases and an estimated 68.5 million cases for its 2024 reporting context, with an estimate range of 49.1–92.5 million. The model uses survey and other evidence to infer case burden missed by routine records. The gap is not proof that either figure is a simple complete count. It warns that testing, care-seeking and reporting affect the observed burden. WHO profile data and methodological footnotes.
The WHO 2023 country assessment described transmission throughout Nigeria and particularly high incidence in northern and north-eastern areas. This is a dated spatial finding, not a claim that every northern district always exceeds every southern one. Rurality, household wealth, vector ecology and access produce further differences. Child parasite prevalence and annual case counts can also move differently: population growth, age structure, episodes per person and better detection can keep totals high while prevalence in a sampled age group falls.
A percentage-point change subtracts two percentages. A relative percentage change divides that change by its original value.
Worked example — percentage points and relative reduction
Illustrative dataset: prevalence in a study population falls from 30% to 24%.
Worked example — a different starting prevalence
Illustrative dataset: prevalence elsewhere falls from 45% to 36%.
The same relative reduction can produce different percentage-point falls because the starting values differ.
Continue this lesson.
You’re previewing NovaLearn without an account. Create a free account to read the rest.
Create free account