1.1.1 - Contrasting coastal landscape systems
A coastal landscape is a connected arrangement of landforms, rather than a collection of isolated features. This lesson compares the high-energy Holderness coast in the UK with the sheltered intertidal Wadden Sea beyond the UK. It explains their physical controls, links among landforms and changes across timescales, then develops methods for observing, mapping and analysing coastal evidence.
The high-energy Holderness coast
Holderness faces the North Sea on England's east coast, south of the chalk headland of Flamborough and north of the Humber Estuary. It provides a high-energy case because exposed sections receive energetic waves capable of eroding cliffs and redistributing beach sediment. Exposure varies along the coast: the headland shelters some locations and local beach width changes how much energy reaches the cliff.
The coastal setting contains an important geological contrast. Jointed chalk at Flamborough supports steep cliffs, caves and stacks, whereas much of Holderness consists of less resistant, unconsolidated glacial deposits. At Aldbrough, BGS has monitored landslides and retreat since 2001. Its case account identifies rotational slumps, falls and topples. Rainwater weakening and wave removal of support therefore combine to explain retreat. The same account reports average retreat at the Aldbrough caravan site of 1.16 metres per year for 1852–1951, derived from historical maps, and 2.16 metres per year for 1951–2004, derived from cliff surveys. These are specific historical intervals and methods at one site, rather than a uniform present-day rate for all Holderness. They demonstrate rapid retreat while showing why a rate needs a location, period and measurement method. BGS Aldbrough case study.
Cliff erosion releases sediment into beaches and nearshore stores. Waves and currents sort it: fine material can travel offshore in suspension while sand and coarser particles follow different routes. Net alongshore movement in the southern part of the system supplies sediment towards Spurn, the spit at the Humber entrance. This links loss from an erosional source with maintenance of a depositional landform. The shoreline plan's coastal-processes assessment documents those connections; it does not imply that all eroded material reaches Spurn.
Spurn separates exposed North Sea water from sheltered estuarine areas. Its sediment ridge, dunes and sheltered mudflats occupy different energy environments within one connected system. River and tidal flows through the Humber prevent the ridge simply extending across the whole entrance. East Riding's coastal description records the contrasting northern cliffs and southern spit landscape.
This case shows why “high energy” describes a dominant influence rather than uniform conditions. Resistant headland rock, erodible till, a mobile beach and an estuarine spit can coexist because geology, exposure and sediment connectivity differ spatially.
The low-energy Wadden Sea
The Wadden Sea extends along the North Sea coasts of the Netherlands, Germany and Denmark. Its sheltered areas behind barrier islands provide the contrasting low-wave-energy landscape. The open North Sea side of an island can experience storms, so the low-energy case is specifically the back-barrier intertidal setting rather than every part of the region.
Barrier islands reduce direct wave attack on the tidal basins behind them. Tidal inlets allow water and sediment to pass between the open sea, channels and flats. Sand settles in suitable flow conditions, while fine material accumulates on sheltered mudflats. At higher intertidal levels, vegetation traps sediment and stabilises salt marsh. UNESCO's Wadden Sea account identifies this linked barrier, tidal-flat, channel and marsh landscape.
The seabed's inherited relief and the space created by rising relative sea level influence where accumulation is possible. A channel does not merely sit beside a flat: it carries tidal water across it and transfers sediment to and from other stores. The 2017 Wadden Sea Quality Status Report treats an inlet, its ebb-tidal delta, adjacent islands and back-barrier basin as a sand-sharing system. Change in one element can induce transfers from the others. For example, extra basin accommodation can draw sediment landwards, affecting the supply available to island beaches. This is a process connection, not proof that every island is currently retreating. Oost and colleagues, 2017.
[DIAGRAM: asset_name: Wadden-type barrier and tidal basin; asset_slug: p04-barrier-basin; caption: A sheltered tidal basin shares sediment with barriers, inlets and the open coast; description: A schematic plan view shows the North Sea above two barrier islands separated by a tidal inlet, an ebb-tidal delta seaward, a branching channel within the sheltered basin, tidal flats and landward salt marsh. Two-headed arrows indicate sediment exchange. This is an explanatory Wadden-type arrangement, not an exact map.]
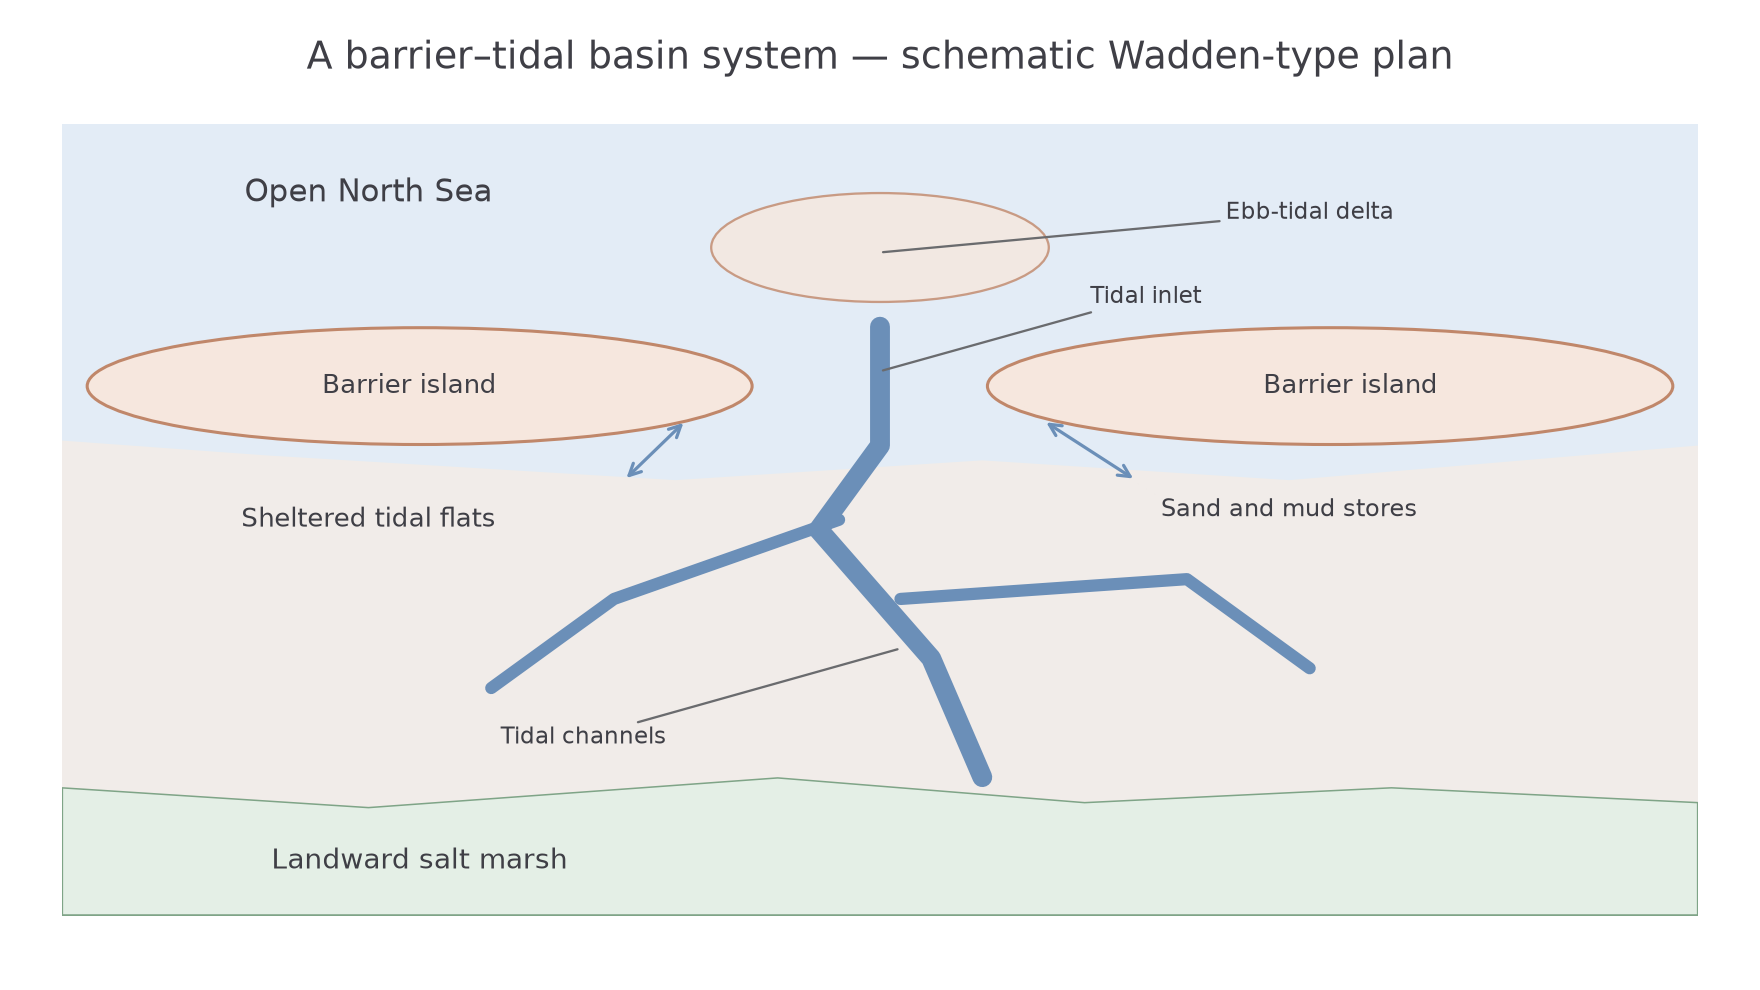
The physical explanation therefore combines wave shelter, tidal transport, low relief, sediment supply and biological stabilisation. “Low energy causes deposition” is incomplete because strong currents can erode an inlet within the same basin. Geology supplies both sediment and an inherited foundation, while water depth and tidal geometry regulate its reworking.
Coastal change from seconds to millennia
The timescale of observation changes which coastal processes appear most important. A cliff block may fall in seconds after months of weathering and rainfall infiltration. The final event is rapid, but its preparation is slower. Averaging retreat over a year can conceal a short collapse followed by a long interval without further movement.
Seasonal wave changes can lower a beach during stormier periods and allow recovery under calmer conditions. This changes the protection available to the cliff. At a Wadden-type barrier, storms can erode the seaward beach or transfer sediment across low parts of the island while tides continue redistributing it. Seasonal vegetation growth can also alter trapping on dunes and marshes. These are conditional mechanisms: a dated survey is needed before claiming that a particular beach recovered fully.
At Spurn, the December 2013 tidal surge breached and overwashed part of the peninsula, damaging its road connection. Yorkshire Wildlife Trust's account describes subsequent reworking and recovery of the sedimentary ridge. A dramatic storm can therefore reorganise a landform without ending the larger sediment system. Spurn's changing landscape describes this event and its aftermath.
Over millennia, relative sea-level change creates or removes space for deposition and shifts shorelines. The Wadden Sea's 2017 reconstruction explains its development through Holocene inundation, sediment infilling and changing human influence. Present barrier and marsh positions are products of that long history, subsequently modified by individual tides and storms. At Holderness and Spurn, long-term cliff retreat and sediment reworking likewise mean that the modern outline should not be treated as a fixed shape through geological time.
There is no contradiction between a beach eroding during a storm and the wider landscape accumulating sediment over a century. The spatial boundary and time interval differ. A defensible comparison states both, then explains how short events contribute to, interrupt or reverse longer-term tendencies.
Observing and measuring coastal change
Coastal evidence becomes stronger when observations, measurements and interpretations are kept distinct. A photograph can show a fresh cliff scar and debris at its foot. Rotational slumping is an interpretation supported by the curved scar and rotated block; the photograph alone may not establish the rainfall trigger. Annotating the visible evidence before explaining its cause prevents circular reasoning.
A beach profile can be measured along a shore-normal transect using ranging poles, a tape and a clinometer, or surveyed with appropriate positioning equipment. Record each segment's length and slope and relate heights to a common datum. Repeating the same georeferenced transect allows comparison, whereas moving the line between surveys can confuse spatial differences with change over time. Record tidal stage, recent weather and instrument precision. Sediment samples should use a consistent selection method and an appropriate measure such as pebble long-axis length; choosing the largest visible stones biases the result.
GIS can overlay dated cliff lines, profiles and sample locations. A coordinate system, map scale and common coastline indicator are essential. The wet/dry boundary on an aerial image is not automatically comparable with a surveyed cliff top. Positional uncertainty can be a large fraction of an apparent small retreat.
Consider this illustrative dataset, invented to practise analysis and not measured at Holderness or the Wadden Sea:
| Site | Beach width in metres | Annual cliff retreat in metres |
|---|---|---|
| A | 10 | 4.1 |
| B | 15 | 3.4 |
| C | 20 | 3.6 |
| D | 25 | 2.5 |
| E | 30 | 2.2 |
Worked summary and association
First total the retreat observations and divide by their count. Order them to find the median and subtract the extremes for the range:
A scatter graph, with width on the horizontal axis and retreat on the vertical, shows a general negative association. The wider beaches tend to accompany less retreat, consistent with wave-energy dissipation across a larger beach. The slight reversal between B and C shows that the association is imperfect.
For an ordinal association, rank both variables from smallest to largest. Width ranks are 1, 2, 3, 4, 5; retreat ranks in site order are 5, 3, 4, 2, 1. The squared rank differences total 38. Spearman's coefficient is:
Here is the difference in paired ranks and . This is a strong negative sample association, not proof that width alone causes the retreat differences. Geology, exposure and defences may vary too, and statistical significance would require an appropriate critical value and test assumptions. Small, selectively chosen samples may not represent the coast.
Worked comparison with a second sample
Illustrative dataset: a second survey has beach widths of 8, 16, 24, 32 and 40 metres paired with retreat of 2.2, 1.9, 1.5, 1.2 and 0.8 metres. Calculate the summaries first:
Ascending width ranks are 1, 2, 3, 4, 5 and retreat ranks are 5, 4, 3, 2, 1. Subtract paired ranks and square:
This sample has lower average retreat and a perfect inverse rank order. Neither result identifies the cause on its own: the surveys may differ in geology, exposure or selection. The coefficient measures ordering, while the mean measures the magnitude of retreat.