2.2.1 2.b - China and trading interdependence
China is an EDC whose trade connects manufacturing networks, resource suppliers and consumer markets across the world. This lesson examines its dated export and import patterns, explains changes since WTO accession, and assesses how economic, political, social and environmental interdependence affects development, stability and equality.
China and current trade patterns
China lies in East Asia and combines a large domestic economy with extensive overseas production and market connections. In OCR's AC–EDC–LIDC framework it is studied here as an emerging and developing country, or EDC. This classification does not imply that its firms lack advanced technology or that living standards are uniform.
China's National Bureau of Statistics communiqué for 2025, released on 28 February 2026, reports goods exports of 26,989.0 billion yuan and goods imports of 18,479.5 billion yuan. These are current-price values in yuan, not dollars. Mechanical and electronic products accounted for approximately 61% of goods exports. Services were also substantial: their exports were 3,626.8 billion yuan and imports 4,455.5 billion yuan, producing a services deficit alongside the goods surplus.
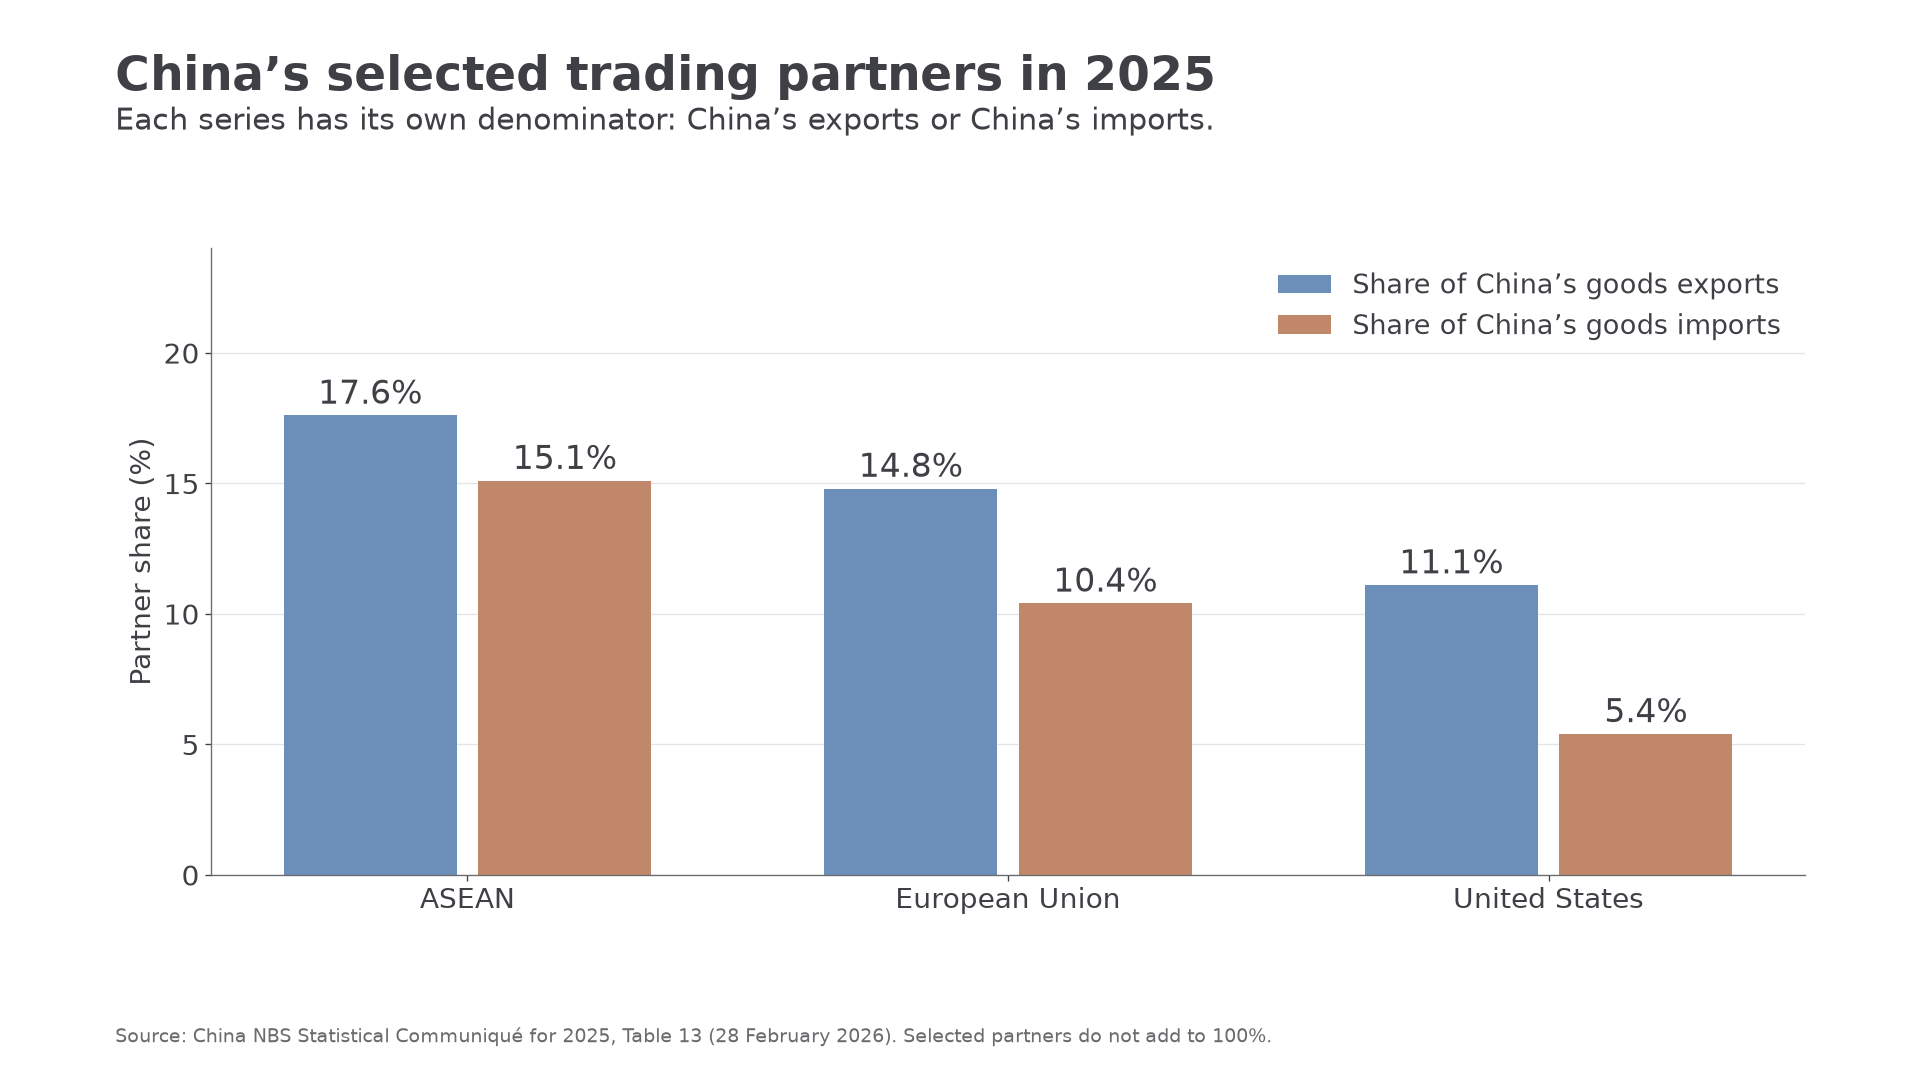
Trade direction combines regional and inter-regional relationships. In that same 2025 source, ASEAN accounted for 17.6% of China's goods exports, the European Union 14.8% and the United States 11.1%. Their respective shares of China's goods imports were 15.1%, 10.4% and 5.4%. Export and import shares have different denominators: the figures do not measure each partner's dependence on China.
[DIAGRAM: asset_name: China’s regional and inter-regional trade partners; asset_slug: h481_h11_partner_shares; caption: ASEAN, EU and US shares differ between China’s 2025 goods exports and imports.; description: Grouped bars show export and import percentages for ASEAN at 17.6 and 15.1, the EU at 14.8 and 10.4, and the US at 11.1 and 5.4. These are selected partners, not a complete allocation. Source is China NBS 2025 communiqué, February 2026.]
The components explain some of this geography. Regional supply chains link machinery, components and final production within Asia. Distant consumer markets purchase manufactured goods, while resource suppliers support production. Australia's Department of Foreign Affairs and Trade account using 2024 evidence identifies iron ore, natural gas and gold as leading Australian exports to China. China therefore depends on imports as well as selling exports; a goods surplus does not mean economic self-sufficiency.
Changing trade connections since 2001
China's trading role has changed through market access, investment, infrastructure and the development of productive capabilities. Membership of a trading institution was one important step within a longer process, rather than the sole origin of its growth.
China joined the WTO on 11 December 2001. Accession placed trading relationships within negotiated commitments and rules, making some market-access conditions more predictable. Combined with domestic reforms, infrastructure, labour and investment, this supported production for external markets and participation in international supply chains.
Initially, participation in some networks relied strongly on processing imported components and supplying overseas firms. Development of domestic suppliers, technical skills and firms' own capabilities can increase the value retained locally. This is upgrading: moving into more productive or higher-value activities, not necessarily abandoning manufacturing. Machinery and electronic products in the 2025 pattern illustrate why China cannot be represented only as a supplier of simple labour-intensive goods.
Trade growth is not uninterrupted. The WTO's 2024 review records merchandise exports rising from US$2,589 billion in 2020 to US$3,594 billion in 2022, then falling to US$3,380 billion in 2023. Imports changed from US$2,069 billion to US$2,716 billion and then US$2,557 billion across the same years. These are nominal values in one review, so both price and quantity changes can contribute.
More recent figures show changing direction as well as scale. The NBS 2025 communiqué reports goods exports to ASEAN growing by 14.0% in yuan value compared with 2024, while exports to the United States fell by 19.5%. Policy, demand, relative prices and production-network changes can all influence such shifts. A one-year bilateral fall is not proof of an end to globalisation: goods may be redirected, different stages may relocate and other markets may expand.
Economic, political, social and environmental interdependence
Interdependence means that places affect and rely on one another through connected activities, but the relationship need not be equal. Its strength depends on each side's alternatives, the importance of the product and the time needed to adjust.
Economic interdependence connects China's producers with component and resource suppliers and overseas buyers. Australian iron ore supports Chinese production while Australian exporters rely on demand from China. Chinese goods supply overseas consumers and firms, while those markets provide earnings and orders. A buyer and supplier may both be important but face different adjustment costs if alternatives are available to only one side.
Continue this lesson.
You’re previewing NovaLearn without an account. Create a free account to read the rest.
Create free account