2.2.1 1.a; 2.2.1 1.b - Global trade patterns and development
International trade connects places through goods, services, investment and the people and knowledge needed to organise them. This lesson explains contemporary trade patterns, compares export values with human development, and examines how the same connections can create growth and stability alongside inequality, conflict and injustice.
Trade components and spatial patterns
International trade involves exchanges across national boundaries, but its components move in different ways and are measured differently. An export leaves the supplying economy for an overseas market; an import enters the purchasing economy from abroad.
Merchandise consists of physical goods, including agricultural commodities, manufactured products and intermediate components. Services include transport, tourism, finance, business support and digitally supplied activities. A foreign visitor buying accommodation is purchasing a service export from the destination country, even though the service is consumed there.
Capital flows are movements of finance, including direct investment in a business and purchases of financial assets. They support and respond to trade, but are recorded separately from goods and services in standard international accounts. Distinguish financial capital from capital goods: an exported machine is merchandise, while financing or purchasing a foreign factory involves a capital flow. Adding investment flows indiscriminately to merchandise exports produces a misleading total.
The WTO's March 2026 statistical report estimated 2025 world merchandise exports at US$26.26 trillion and commercial-services exports at US$9.56 trillion. These are current-price values, not measures of the physical volume traded. Their statistical bases also differ, so a consistent goods-and-services total should come from a matched accounting series rather than casual addition.
Trade is spatially concentrated. In the same report, China accounted for 14.4% of world merchandise exports in 2025, while the United States accounted for 13.2% of merchandise imports. Regional networks matter alongside long-distance connections. Germany–France exchanges illustrate intra-regional European trade; China–United States exchanges illustrate inter-regional trade between Asia and North America. China–Viet Nam component exchanges are intra-regional within Asia, while Ethiopia–European Union coffee trade links different regions. The classification depends on the regional boundary used, which should be stated.
Trade and development indicators
Trade patterns and socio-economic development influence one another, but export value alone does not measure people's wellbeing. A country's total exports depend on its population, resources, prices, economic structure and position in production networks as well as its level of development.
The Human Development Index, or HDI, combines indicators of health, education and income into an index between 0 and 1. It is broader than output or exports, although national averages still conceal inequalities. The following common-year comparison pairs 2023 merchandise exports with 2023 HDI values published in the 2025 Human Development Report.
| Economy | Merchandise exports in 2023, approximately US$ billion | HDI in 2023 |
|---|---|---|
| China | 3,380 | 0.797 |
| United States | 2,020 | 0.938 |
| Ethiopia | 2.86 | 0.497 |
Sources: WTO April 2024 trade statistics, World Bank WITS Ethiopia 2023 and UNDP Human Development Report 2025. Values are deliberately dated; they are not labelled 2026 observations.
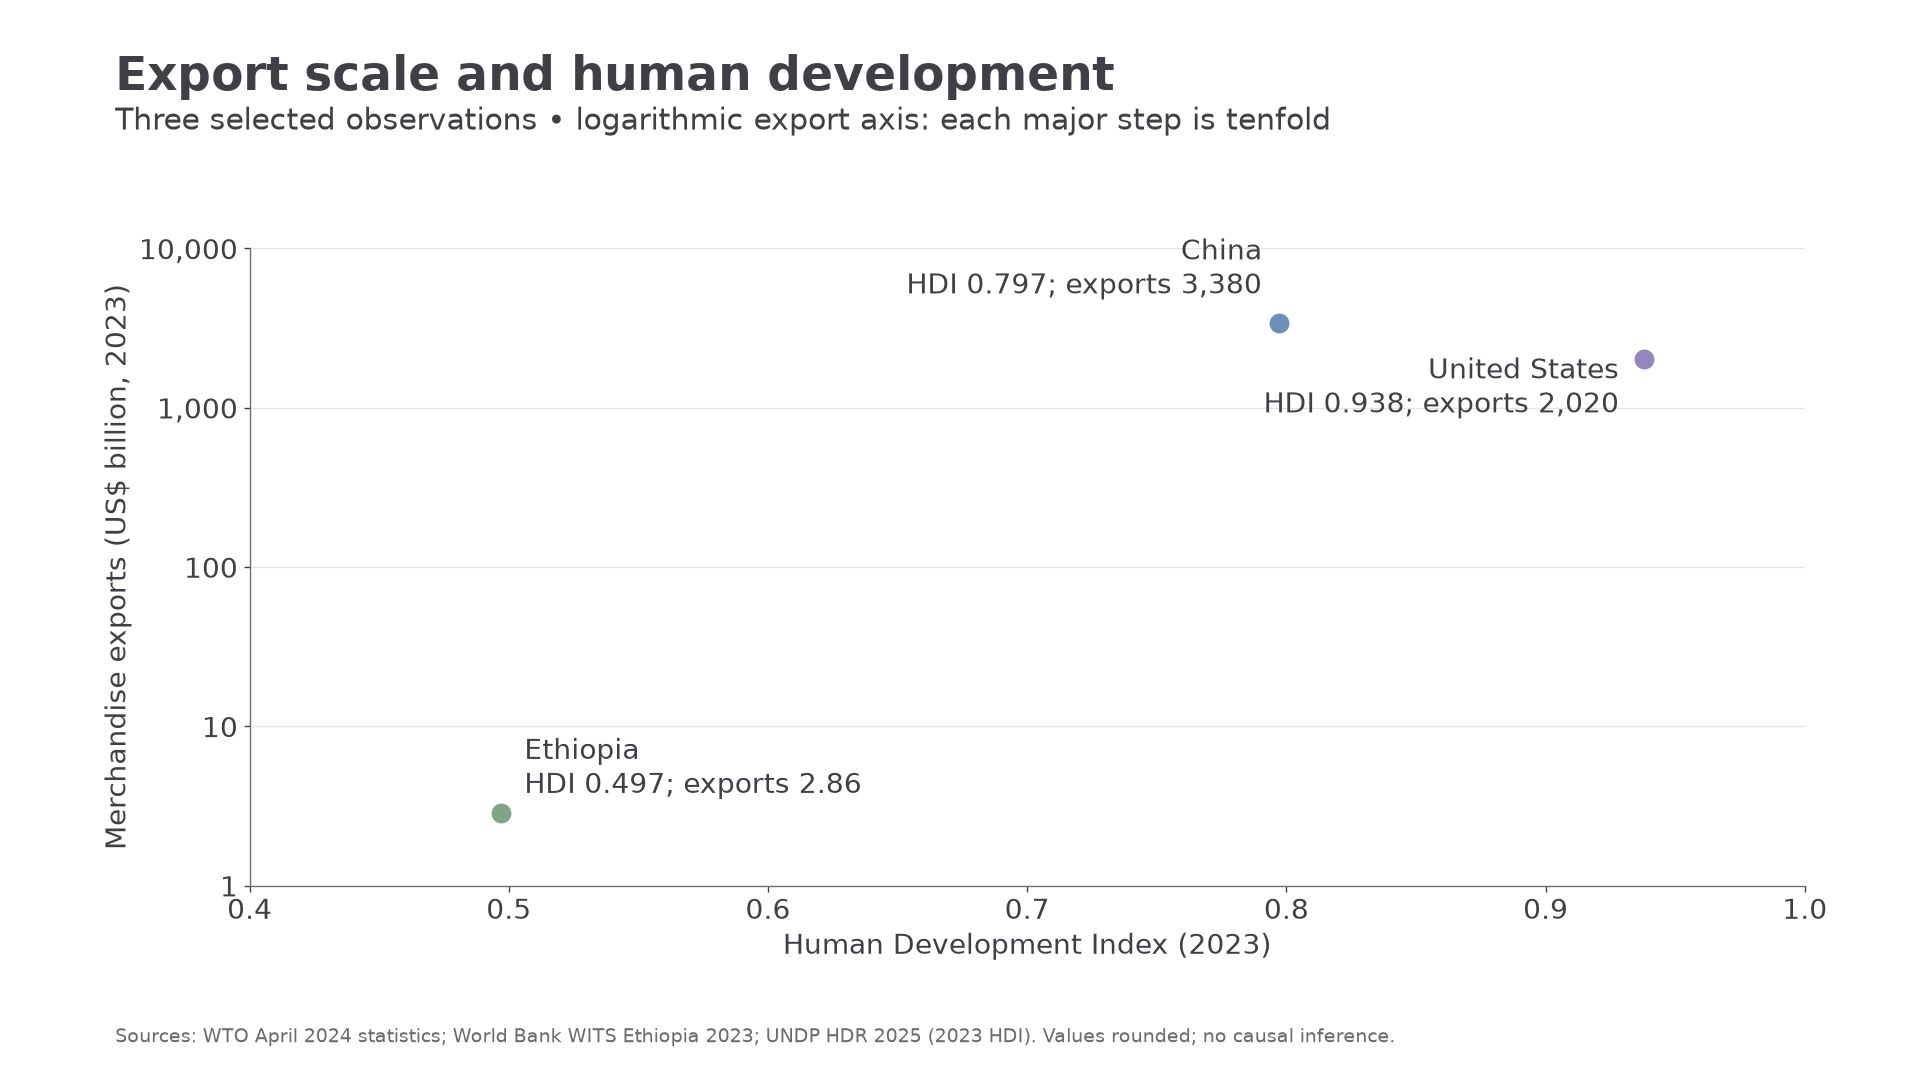
The table shows a large contrast between Ethiopia and the two major exporters, consistent with the importance of productive capacity, infrastructure and market access. Yet China exported more merchandise than the United States while having a lower HDI. A simple claim that larger exports automatically mean higher human development therefore fails. Services, population size, domestic income distribution and public provision also matter.
The diagram uses a logarithmic export axis because the values differ so greatly: equal steps from 1 to 10 to 100 to 1,000 represent tenfold increases, not equal dollar additions. Read the labelled values before comparing distances. Three selected observations illustrate a problem with a simple claim; they are too few to establish a general statistical relationship.
[DIAGRAM: asset_name: Export value and human development; asset_slug: h481_h09_exports_hdi; caption: Three 2023 observations illustrate why export scale and human development are related but not interchangeable.; description: A scatter plot places HDI on the horizontal axis and merchandise exports in US dollar billions on a logarithmic vertical axis. China is at 0.797 and 3380, the United States at 0.938 and 2020, and Ethiopia at 0.497 and 2.86. Three selected countries cannot establish a general statistical relationship.]
Explain mechanisms before claiming causation. Better education and infrastructure can enable higher-value exports; export earnings can help finance investment and public services. Both may also respond to government policy or technological change. Gross exports include imported inputs and do not show how much income remains locally. Qualitative evidence, such as workers' accounts and firm interviews, can reveal job security, bargaining power and barriers hidden by totals. Such accounts complement statistics but do not establish national prevalence on their own.
Continue this lesson.
You’re previewing NovaLearn without an account. Create a free account to read the rest.
Create free account