2.1 1.a - Local place profiles and changing connections
A place acquires its identity through its population, environment, institutions and connections, and these change over time. This lesson compares Ladywood and Sutton Four Oaks in Birmingham, then explains how flows of people, resources, investment and ideas connect these local places to a much wider world.
The dimensions of a place profile
A place profile is an evidence-based account of the characteristics that make a location distinctive. A useful profile explains relationships between characteristics rather than producing an inventory of attractions.
Place identity
The distinctive characteristics and meanings associated with a place, produced through its environment, people, history and connections.
Six dimensions help organise a profile. Demographic characteristics describe population, including age structure and migration. Socio-economic characteristics concern employment, income, qualifications and housing. Cultural characteristics include languages, beliefs, heritage and everyday practices. Political characteristics concern who makes decisions, how people are represented and whose interests influence development. The built environment includes streets, homes, workplaces and transport infrastructure. The natural environment includes relief, water, vegetation and habitats, even where people have substantially modified them.
These dimensions interact. A railway can make a neighbourhood accessible to commuters; demand for homes can raise prices; the resulting population can support particular shops and influence local planning priorities. The railway is a built characteristic, but its influence extends into the demographic, economic, cultural and political dimensions.
The unit of study matters. A ward is a local electoral and statistical area; a neighbourhood is often defined through experience and local recognition. The case studies here use Ladywood ward and Sutton Four Oaks ward, as represented in Birmingham City Council's January 2024 factsheets, whose population tables reproduce Census 2021 counts. They are not the much larger parliamentary constituencies. Administrative boundaries make comparison possible, but do not enclose all the relationships that create identity.
Ladywood and its place identity
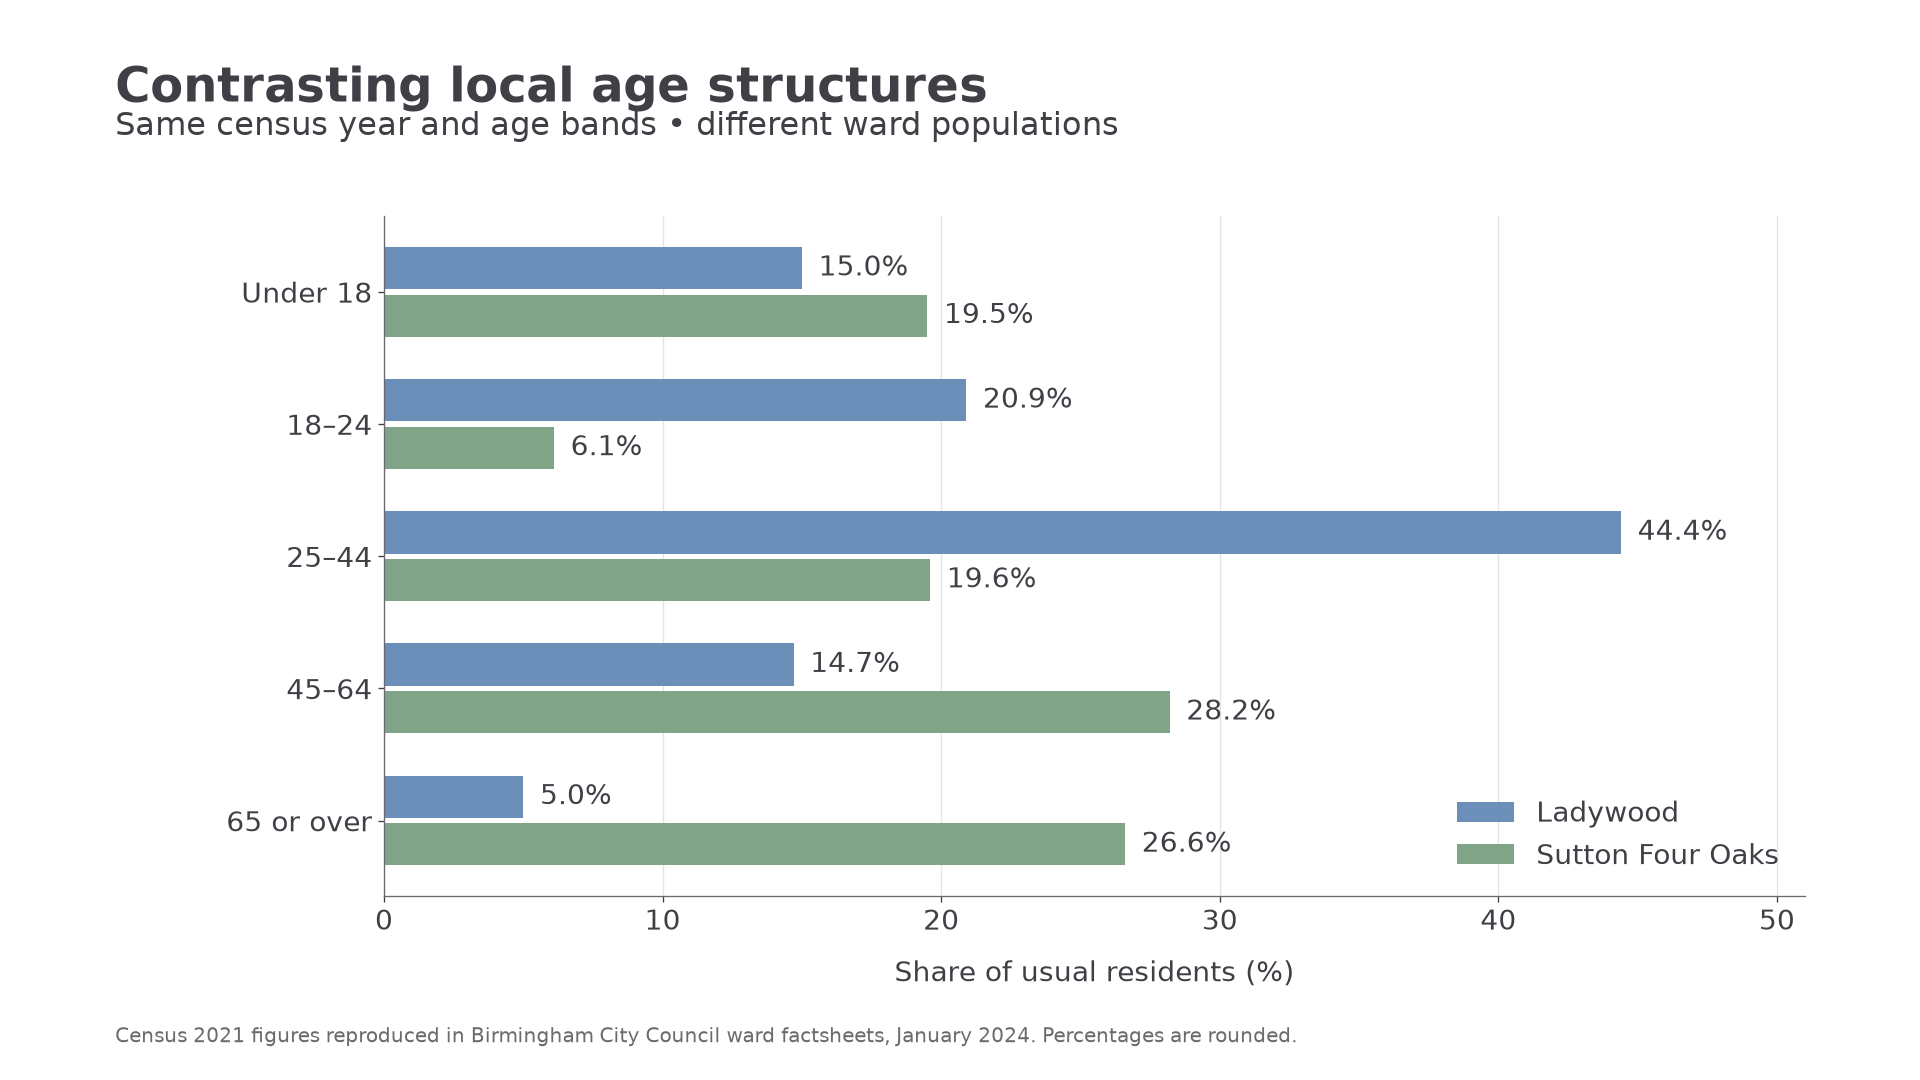
Ladywood ward combines a central urban location with markedly different residential experiences. The council's January 2024 factsheet, pages 1–4, describes a ward containing much of Birmingham city centre and reports a 2021 population of 25,738. Its population included 44.4% aged 25–44 and only 5.0% aged 65 or over. This supports a profile strongly influenced by younger adults and city living; it does not establish the motives of every resident.
The same source reports that 51.4% of residents aged 16 or over held level 4 qualifications or above. A central location can connect qualified residents with professional employment, while shops, hospitality and other services support a wider occupational range. A high qualification average does not mean all households are affluent: established housing estates and newer city-centre accommodation coexist. This mixture is central to the ward's identity.
Its cultural profile is also diverse. The factsheet records English as the main language for 70.0% of adults aged 16 or over. Language diversity can support different social networks, places of worship, shops and cultural activities, although language alone cannot reveal an individual's beliefs or identity.
The council's Ladywood Ward Plan 2022–2026 identifies housing, hardship, public space and transport among local concerns. These are political characteristics: councillors, residents, landlords and developers have different powers over the area's future. Its built character includes housing estates, apartments and central infrastructure. Canal corridors provide water, vegetation and potential recreation within this heavily modified urban environment. The council's 2024 Central Birmingham Framework discusses the Birmingham Old Line Canal through Ladywood and Spring Hill as a connection to the central city. Thus its natural and built features overlap rather than forming separate worlds.
Sutton Four Oaks and its place identity
Sutton Four Oaks provides a contrasting suburban profile within the same local authority. The council's January 2024 factsheet, pages 1–4, reports a 2021 population of 9,331, with 26.6% aged 65 or over and 19.6% aged 25–44. Its older population creates different potential demands for healthcare, accessible transport and community facilities from those suggested by Ladywood's age structure.
Among employed residents, 66.5% were in the factsheet's higher-skilled occupational grouping, compared with 57.8% in Ladywood. This describes residents' occupations, not the jobs physically located in each ward. A residential suburb can contain relatively few workplaces while housing people who commute to high-skilled employment elsewhere. Its socio-economic character therefore depends partly on external connections.
The built and natural environment contribute another contrast. The Four Oaks Estate's substantial houses, landscaping and proximity to Sutton Park are documented in the council's conservation designation report, designated in 1986 and retained on the council's conservation-area list in 2026. The estate is one part of the ward, not a description of every street. Trees and gardens help create a greener suburban image, while conservation rules give some built and landscape characteristics political protection.
Heritage preservation is itself a cultural practice: residents and organisations select what they consider worth retaining. The conservation report records disagreement about additional controls, demonstrating that apparently shared suburban identity can contain competing interests. Today's cultural profile also reflects a varied population; the factsheet reports that 95.5% of adults aged 16 or over had English as their main language. That comparison with Ladywood indicates different language profiles, not cultural superiority or complete uniformity.
[DIAGRAM: asset_name: Contrasting ward age structures; asset_slug: h481_h01_age_structure; caption: Census 2021 age shares show Ladywood’s concentration of younger adults and Sutton Four Oaks’ older population.; description: Grouped horizontal bars compare percentages in five age groups. Ladywood values are 15.0, 20.9, 44.4, 14.7 and 5.0; Sutton Four Oaks values are 19.5, 6.1, 19.6, 28.2 and 26.6. Source is Birmingham ward factsheets, January 2024.]
Worked examples: comparing percentage shares
Example 1. Illustrative dataset: home internet access is recorded for 85.4% of households in one district and 72.8% in another. Subtract the smaller percentage from the larger to find the gap.
Continue this lesson.
You’re previewing NovaLearn without an account. Create a free account to read the rest.
Create free account