2.1 2.b; 2.1 6 - Representing and investigating places
Representations show selected aspects of a place and help shape what people think it is like. This lesson compares informal media with census and geospatial evidence, explains how to construct and interpret representations, and examines how qualitative research actively produces particular place meanings.
Informal media and place meanings
Informal representations communicate experiences and interpretations without necessarily following a standard statistical method. They may be valuable evidence of meaning even when they are selective accounts of material conditions.
Different media create meaning differently. Television can repeatedly associate a setting with particular characters or social problems. Film combines camera position, lighting, sound and editing to make the same street appear threatening or inviting. Music links places to emotion, identity and shared memory, sometimes making a location meaningful to people who have never visited. Art may celebrate a landscape or challenge a dominant account of its history.
Photography selects an instant and viewpoint. A crowded pavement photographed at lunchtime and an empty one at dawn tell different stories without either image necessarily being fake. Literature can reveal a narrator's inner experience, while its narrative voice remains an interpretation rather than an objective survey. Graffiti can claim space, express protest or become a marker of a creative district; the meaning depends on who produces, authorises and encounters it. Blogs combine personal accounts, images and recommendations, but their writers and readers are not a random sample of everyone using a place.
These forms can reinforce each other. An illustration of an old factory, a music event and a visitor blog may together reposition an industrial district as a cultural destination. Alternatively, a resident's account of noise can challenge that image. Do not classify every unofficial representation as inaccurate or every attractive image as propaganda. Ask what experience it illuminates, how it was produced and what it leaves outside the frame.
Worked application — a visual detail and place identity
Illustrative resource: a photograph shows a former dockside warehouse retaining its loading doors, with an art studio sign beside its entrance. With reference to the photograph, explain one way the area's identity is changing. The retained loading doors are visible evidence of an inherited goods-handling function. The studio sign identifies a new creative use of the same premises. Reusing the building therefore joins industrial heritage with cultural production, helping create an identity based on adaptation rather than complete replacement. The answer starts from a specific visible detail and develops its meaning; it makes no unsupported claim about the whole district's employment or residents.
Formal statistics and geospatial representations
Formal representations use explicit categories, measurement rules and procedures intended to make evidence comparable. Census tables can describe an entire area's population, while geospatial data connects attributes to locations, points, routes or bounded areas.
A statistic is still a representation. Decisions about categories, dates and boundaries determine what appears. Birmingham's January 2024 ward factsheets, for example, combine Census 2021 characteristics, 2019 deprivation rankings and 2021/22 child low-income measures. Their shared publication date does not make those observations simultaneous.
To present place characteristics geospatially, first define the question and select a suitable spatial unit. Join an attribute table to the correct boundary file using a shared area code, rather than similar-looking names. A choropleth map shades areas according to a variable. Normally map a comparable rate or percentage, such as the share of households without a car, rather than raw totals that largely reflect population size. State the observation date, denominator, units, data source and boundaries used.
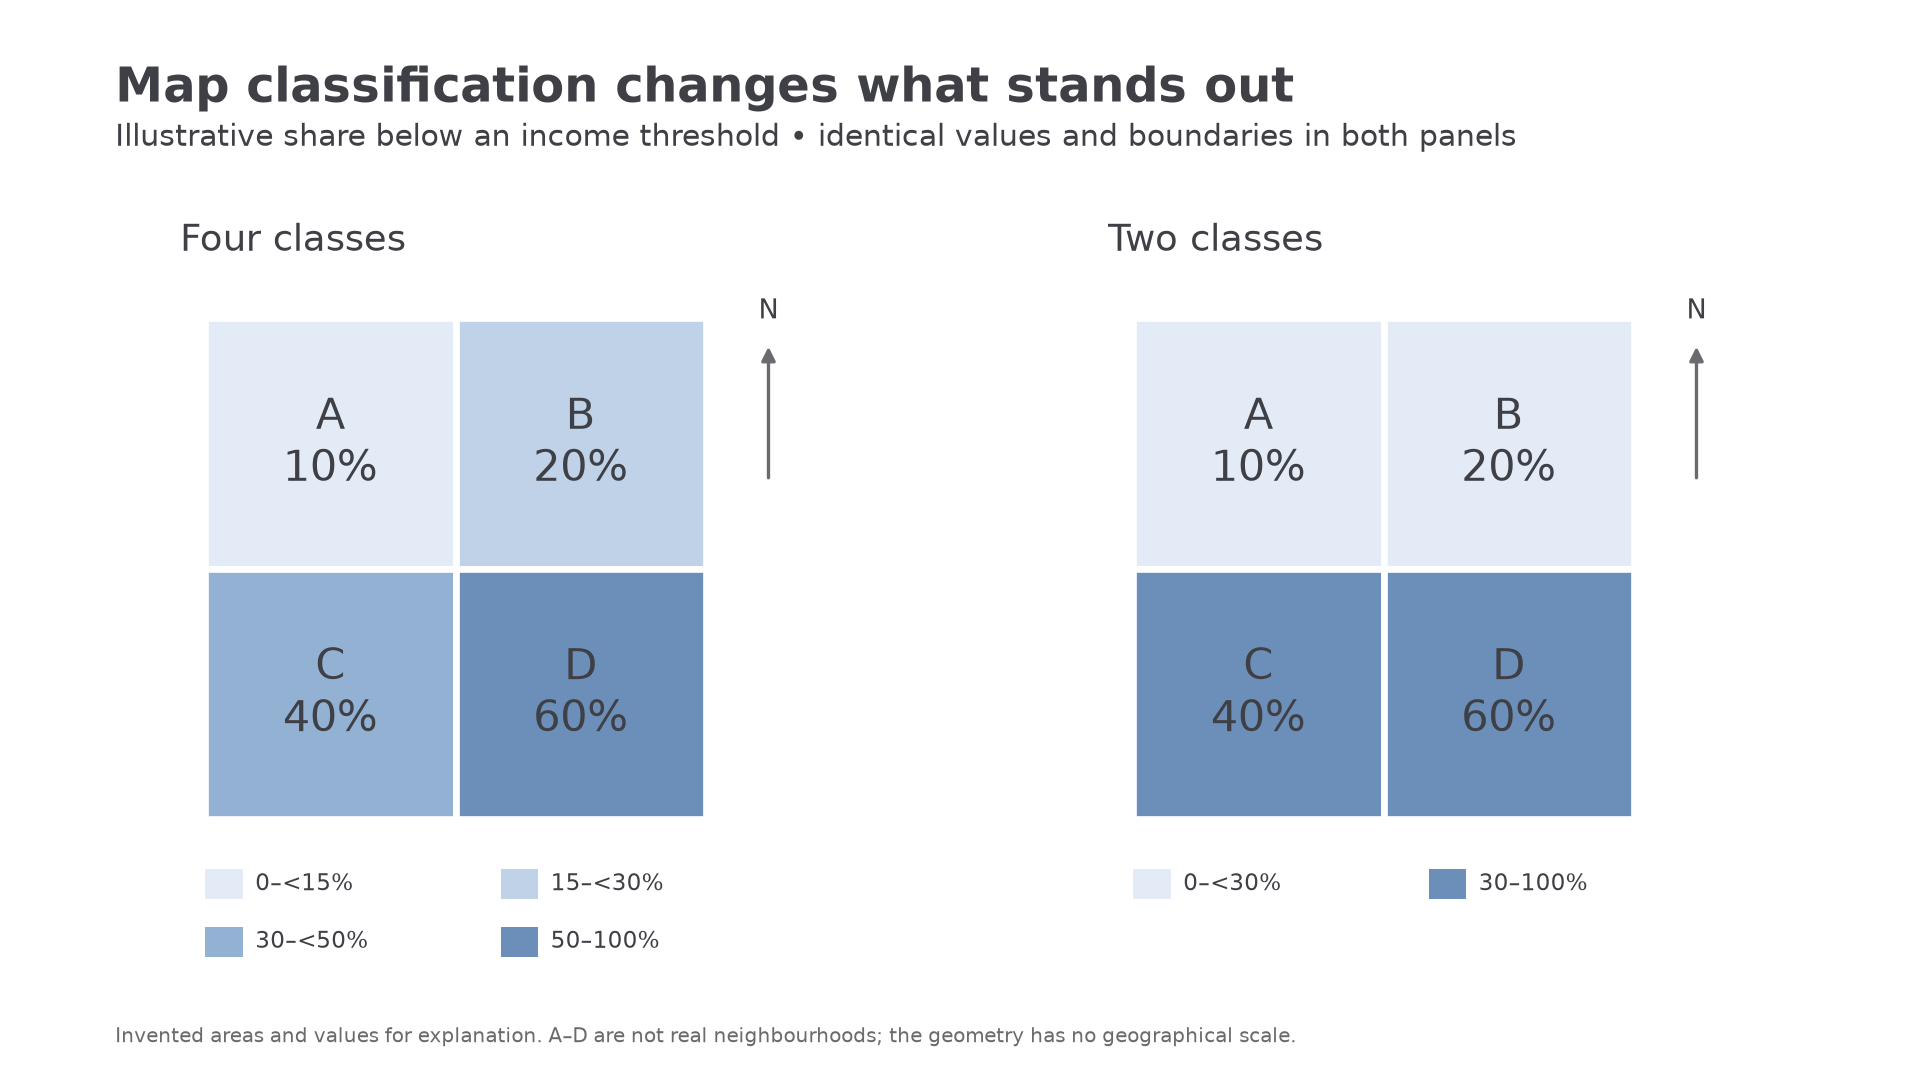
Classification also matters. A map dividing percentages into two broad classes conceals differences visible in four narrower classes. Use a consistent light-to-dark sequence for increasing values and a legend giving clear, non-overlapping intervals. Include orientation and scale where a real geographical map needs them. Do not interpret a large polygon as having more affected people solely because it occupies more paper.
Worked example — a share for a choropleth
Illustrative dataset: district R has 45 unemployed residents among 360 working-age residents. The map will show the unemployed share of working-age residents.
Use 12.5% to select R's map class. This is a share of working-age residents; the standard unemployment rate instead uses the economically active population as its denominator.
Worked example — a different population base
Illustrative dataset: district S has 84 households without a car among 240 households. Both numerator and denominator count households.
The legend must describe households, not residents: one household can contain several people. Defining the denominator comes before shading a map.
[DIAGRAM: asset_name: Classification changes a place representation; asset_slug: h481_h03_choropleth; caption: Two choropleths use the same illustrative percentages but different class boundaries.; description: Four adjacent illustrative areas A to D have values 10, 20, 40 and 60 per cent. One map uses four classes and the second uses two classes, showing how classification can hide variation. Both include value labels, north arrows and legends; the diagram represents no real place.]
An informal account can reveal fear, belonging or exclusion that a census variable does not measure. A map can reveal a spatial pattern that one interview cannot establish. Use their complementary strengths, while remembering the ecological fallacy: a characteristic of an area does not necessarily describe every individual living there.
Continue this lesson.
You’re previewing NovaLearn without an account. Create a free account to read the rest.
Create free account