H460/03 - Evidence in unseen economies
An unseen source can contain accurate figures but support an inaccurate conclusion. Learn to put measures on comparable bases, connect a market change to the wider economy, and judge how strongly the evidence supports a claim about living standards.
Real output per person
A change in money expenditure can reflect prices, quantities or both, so establish what a figure measures before interpreting growth.
The following data are original illustrative figures for the fictional economy Meridian, not observations about a real country. GDP and population refer to the same whole economy and calendar year; the GDP deflator has 2023 = 100.
| Measure | 2023 | 2024 |
|---|---|---|
| Nominal GDP, £ billion | 400 | 440 |
| GDP deflator | 100 | 110 |
| Population, million | 20 | 21 |
Nominal GDP measures output at the year's prices. Real GDP removes the effect of price changes. Using a deflator with base 100:
Meridian's 2024 real GDP is billion at 2023 prices. Nominal GDP rose 10%, but real output did not grow. Subtracting price inflation from nominal growth is sometimes an approximation; division gives the exact real level here.
Real GDP per capita divides real output by population. Convert compatible units: £400 billion divided by 20 million people is £20,000 per person in 2023. In 2024 it is £400 billion divided by 21 million, about £19,048. The percentage change is . Unchanged total output is spread over more people. This is an average of production per resident, not each person's income or take-home pay.
What averages conceal
An economy-wide average can rise while the position of a typical household changes little.
Mean income is total income divided by the number of households. Median income is the middle income after ordering households from lowest to highest; with an even number it is the mean of the two central values. Quantiles divide an ordered distribution into equal population groups. Quintiles are fifths; an income share tells us what fraction of total income a group receives, not what fraction of households it contains.
Consider five illustrative households with annual disposable incomes of £20,000, £22,000, £24,000, £26,000 and £108,000. Their total is £200,000. The mean is £40,000, but the median is £24,000. With equal household weights each household is one fifth of this tiny population: the top fifth receives of income, while the bottom fifth receives 10%.
If only the highest income rises to £128,000, total income becomes £220,000 and the mean rises to £44,000, a 10% increase. The median remains £24,000. The top-fifth share rises to about 58.18%; the bottom-fifth share falls to about 9.09% although that household's money income is unchanged. Distinguish a falling share from a falling income level. Likewise, a share moving from 10% to 12% rises by 2 percentage points, or 20% relative to its starting share.
A national survey needs far more than five households. Its sample must represent different regions and income groups, and comparison should keep household size, price adjustment and income definition consistent. Grouped data usually cannot reveal the exact median or each household's circumstances without further assumptions. GDP per capita also differs from disposable household income because output income may go to firms, government or overseas owners.
Comparing tables and graphs
An index allows variables with different units to be compared by their change relative to a stated base.
For any series, . An index of 107.5 means a value is 7.5% above its base; it does not mean growth of 107.5% or output of £107.5 billion. Growth from index 105 to 110 is , not 5%.
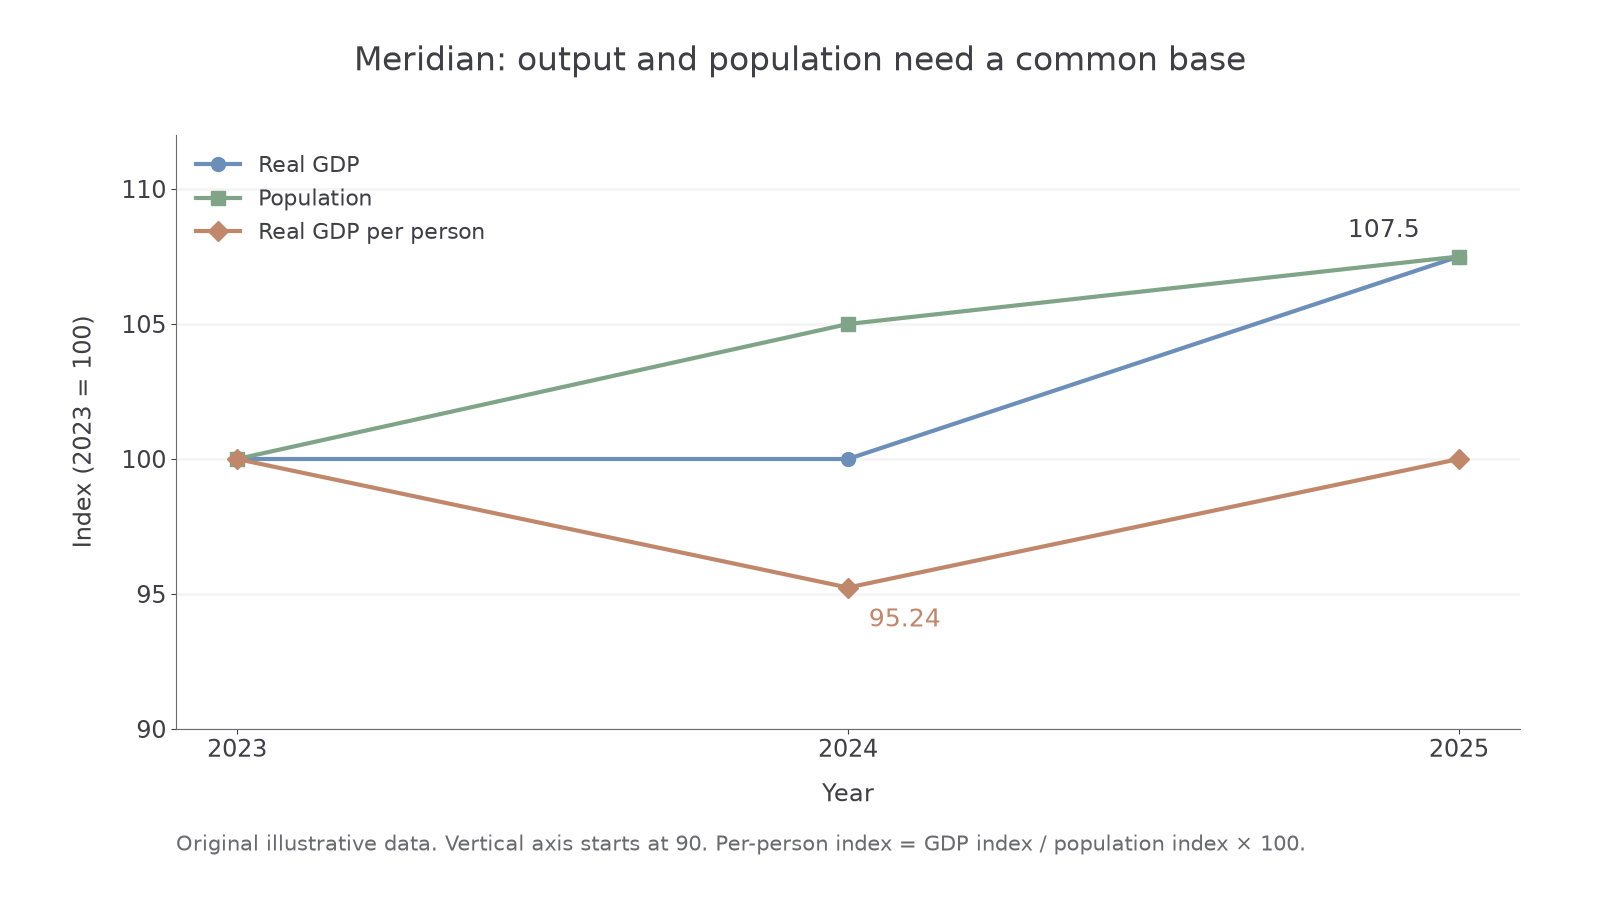
Meridian's revised 2025 real GDP is £430 billion and population is 21.5 million. The diagram combines these with the earlier table. Real GDP and population both have index 107.5 in 2025, so real GDP per capita is back at its 2023 level of £20,000. In 2024 the per-capita index is . Divide the output index by the population index; do not subtract them to find the per-capita index.
[DIAGRAM: asset_slug: themes-evidence-indices; caption: Meridian real GDP, population and real GDP per person, with 2023 equal to 100; description: Exact original-data line graph showing real GDP indices 100, 100, 107.5; population indices 100, 105, 107.5; and per-capita indices 100, 95.238, 100 in 2023–2025.]
Continue this lesson.
You’re previewing NovaLearn without an account. Create a free account to read the rest.
Create free account