2.6 - UK performance in a changing world
Macroeconomic performance depends on which outcome, period and population you measure. Use twenty years of UK evidence to connect shocks with economic mechanisms, then compare recent UK results with developed, emerging and developing economies without mistaking a growth rate for a standard of living.
A dated twenty-year evidence base
A useful performance comparison begins with defined indicators, compatible periods and a fixed publication date.
This evidence is frozen on 30 September 2026. The table covers every complete year from 2006 to 2025; separate partial-year observations below extend the overview into 2026. There is no observed whole-year 2026 result yet. GDP growth measures annual real output change; CPI inflation measures annual-average consumer price change; unemployment is the LFS rate for ages 16 and over; the current balance is a percentage of nominal GDP. A negative current balance denotes a deficit. Annual averages hide within-year peaks and turning points.
| Year | Real GDP growth (%) | CPI inflation (%) | Unemployment (%) | Current account (% of GDP) |
|---|---|---|---|---|
| 2006 | 2.2 | 2.3 | 5.4 | −3.1 |
| 2007 | 3.0 | 2.3 | 5.3 | −3.6 |
| 2008 | 0.0 | 3.6 | 5.7 | −3.7 |
| 2009 | −4.5 | 2.2 | 7.6 | −2.8 |
| 2010 | 2.4 | 3.3 | 7.9 | −2.5 |
| 2011 | 1.1 | 4.5 | 8.1 | −1.4 |
| 2012 | 1.7 | 2.8 | 7.9 | −2.8 |
| 2013 | 1.9 | 2.6 | 7.6 | −4.3 |
| 2014 | 3.2 | 1.5 | 6.2 | −4.6 |
| 2015 | 2.2 | 0.0 | 5.4 | −4.7 |
| 2016 | 2.2 | 0.7 | 4.9 | −5.1 |
| 2017 | 3.3 | 2.7 | 4.4 | −3.3 |
| 2018 | 1.6 | 2.5 | 4.1 | −3.5 |
| 2019 | 1.4 | 1.8 | 3.8 | −2.3 |
| 2020 | −10.0 | 0.9 | 4.6 | −2.8 |
| 2021 | 8.5 | 2.6 | 4.6 | −0.8 |
| 2022 | 5.0 | 9.1 | 3.8 | −2.0 |
| 2023 | 0.4 | 7.3 | 4.1 | −2.5 |
| 2024 | 1.1 | 2.5 | 4.3 | −2.9 |
| 2025 | 1.2 | 3.4 | 4.9 | −3.0 |
Sources: ONS GDP IHYP/QNA, 30 September 2026, CPI D7G7/MM23, 16 September 2026, unemployment MGSX/LMS, 15 September 2026, and current account AA6H/PNBP, 30 September 2026. These are the downloaded vintages, including revisions, not figures copied from an older newspaper.
Read a change in a rate carefully. Unemployment rising from 4.3% to 4.9% is 0.6 percentage points, about relative to the earlier rate. It is not evidence that 0.6% of the entire population became unemployed, because its denominator is the labour force and that can change.
Connecting trends to economic mechanisms
Historical comparisons are more useful when they explain a plausible mechanism and test it against several indicators.
[DIAGRAM: asset_slug: ocr_h460_uk_growth_prices; caption: UK annual real growth and CPI inflation, 2006–2025; description: Two panels plotting the exact frozen ONS annual GDP growth and CPI inflation series, each with year on the horizontal axis and percent on the vertical axis, excluding incomplete 2026 annual values.]
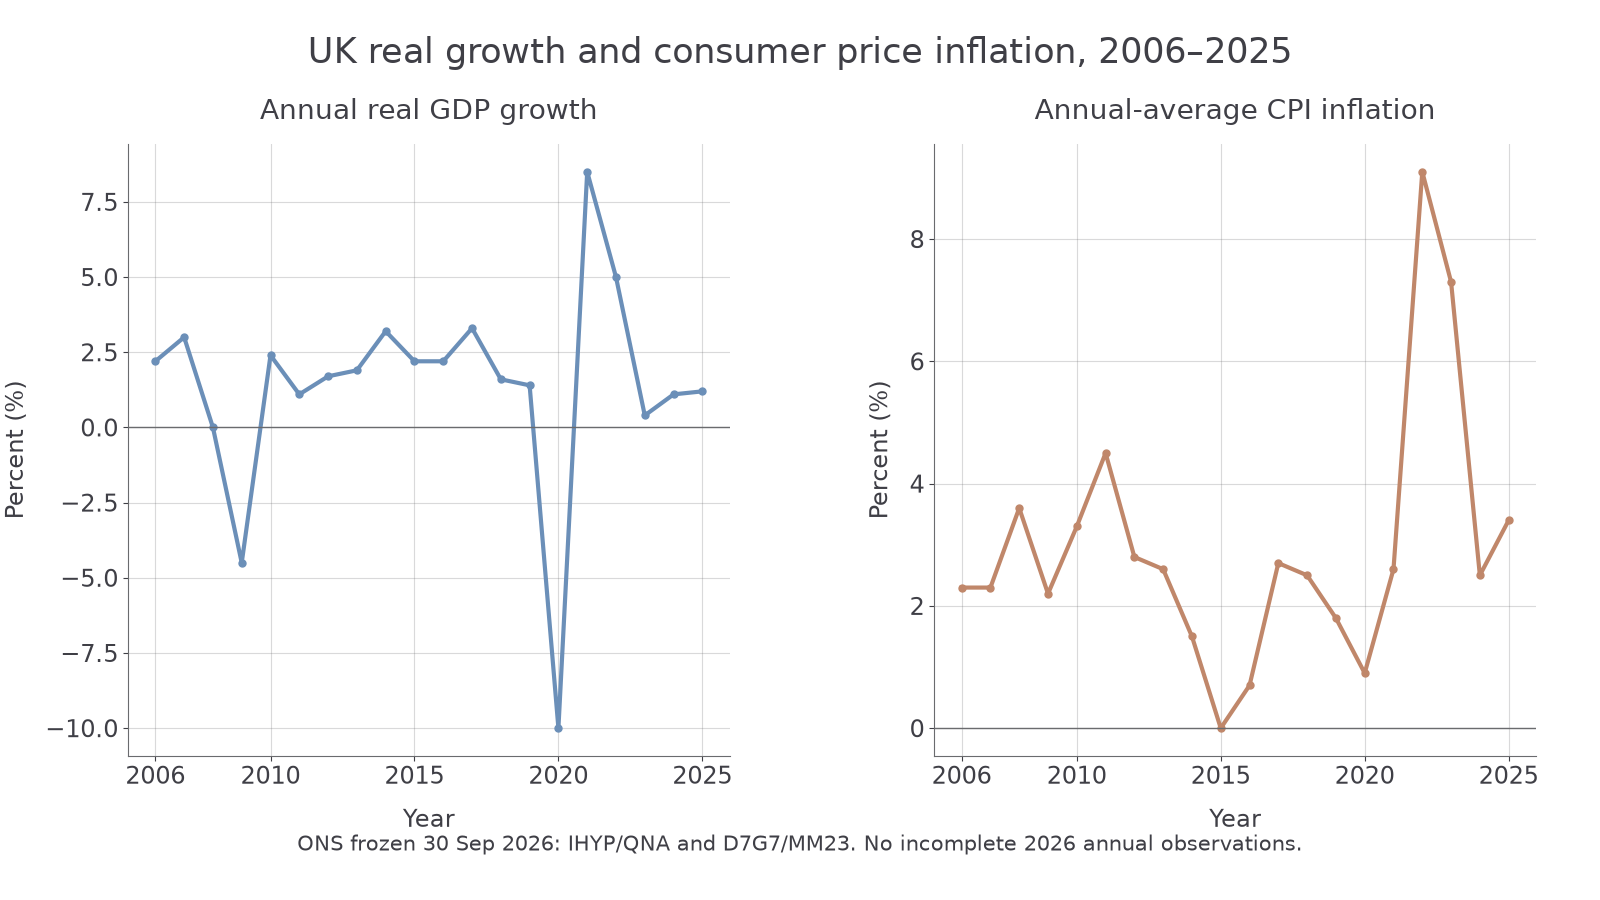
The 2008–09 financial crisis provides a demand-and-credit mechanism: disrupted finance, uncertainty and falling spending can reduce output and hiring. GDP contracted in 2009 while unemployment rose; unemployment remained high after growth resumed because labour-market recovery can lag output and lost skills can persist. This mechanism interprets the pattern; the table alone cannot measure each cause's contribution.
During the later 2010s, unemployment generally declined while annual growth was positive but uneven. Low inflation in 2015 did not show that output was falling. Potential growth depends on productivity, investment and participation, so extra employment can support output without proving strong productivity growth. The persistent current deficit shows that external transactions were another part of the performance picture.
Pandemic restrictions in 2020 disrupted both production and spending. Furloughed workers with jobs could still count as employed, so the unemployment rate did not rise in proportion to the loss of output or hours. Reopening produced strong growth in 2021–22 from a depressed base. If an index of output is 100 before a 10% fall, it becomes 90; an 8.5% rebound makes it 97.65, not 100. Opposite percentage changes do not cancel because the base changes.
Supply bottlenecks and dearer energy help explain the combination of high inflation and weaker growth in 2022–23. Real purchasing power can fall when nominal incomes fail to match prices, weakening consumption; higher production costs can restrict supply. Demand recovery and expectations can also contribute. Disinflation in 2024 did not reverse earlier price rises, and renewed price pressure in 2025 illustrates that convergence to stability need not be smooth. Separate a sourced observation from a theoretical explanation and avoid claiming one cause from correlation alone.
Employment and the external position
Output, unemployment and the current account can move differently, so no single indicator ranks overall performance.
[DIAGRAM: asset_slug: ocr_h460_uk_labour_external; caption: UK unemployment and current-account balance, 2006–2025; description: Two exact frozen ONS annual series with unemployment percent of the labour force and current-account percent of GDP on separate vertical axes; current-account zero is marked and deficits remain negative.]
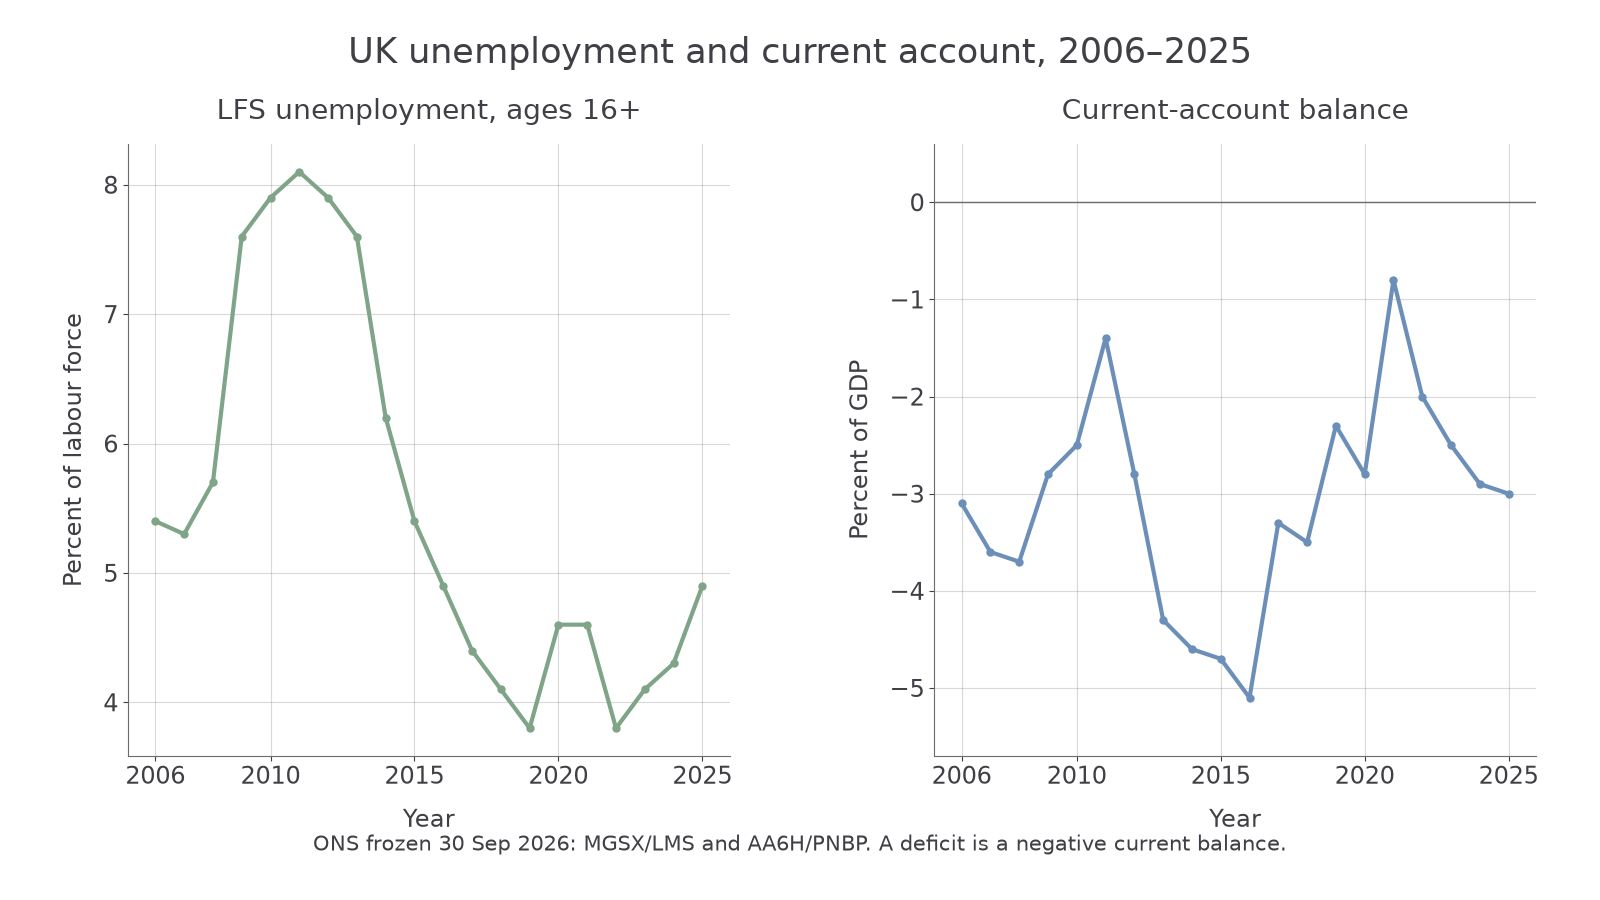
A fall in unemployment can indicate more recruitment, but can also reflect movement into inactivity. Hours, pay, participation, regional opportunities and job security help judge welfare. The LFS is a sample with quality and comparability limitations; small differences should not be treated as exact counts. The 2020 output shock also shows why hours and employment status matter alongside unemployment.
The current deficit narrowed in 2009 while output fell. Weak domestic spending can reduce imports, improving the external balance through a harmful domestic contraction. Conversely, imports of productive capital goods can enlarge a deficit while supporting future capacity. Financial income and funding also matter. The annual current balance was negative throughout this table, but sustainability cannot be diagnosed from that sign alone.
Compare magnitudes using compatible units. An illustrative deficit of £60 billion and GDP of £2,000 billion equals 3% of GDP. If both double, the money deficit is larger but the share is unchanged. A deficit falling from 5.1% to 3.3% of GDP is a narrowing of 1.8 percentage points; “an increase in the balance” and “a decrease in the deficit” describe the same sign-aware change. These statements do not prove that households' welfare improved.
The 2026 snapshot and revisions
The latest available figures often refer to different periods and can be revised, so a current snapshot needs explicit labels.
Continue this lesson.
You’re previewing NovaLearn without an account. Create a free account to read the rest.
Create free account