2.5 - Market equilibrium and connected markets
Demand and supply together explain how a market price coordinates buyers and sellers. Learn why shortages and surpluses create pressure for adjustment, how shifts change equilibrium, and why effects across related markets depend on which relationships actually apply.
Equilibrium and assumptions
Market equilibrium occurs where quantity demanded equals quantity supplied at the same price and in the same period.
Ceteris paribus means other things being equal. It allows an economist to isolate a relationship: when studying a demand shift, hold relevant supply conditions unchanged unless the question also changes them. It is a modelling assumption, not a claim that all real-world influences remain fixed. State which market and period you mean before combining curves.
In an illustrative market, inverse demand is and inverse supply is , with price in pounds per unit and quantity in units per week. At equilibrium, , so and . At £7, both buyers and sellers choose five units. To construct the graph, plot D through (0,12) and (12,0), S through (0,2) and (10,12), and mark their intersection E. Dashed projections to the axes identify the equilibrium values.
[DIAGRAM: asset_slug: h460-foundations-equilibrium; caption: Below equilibrium there is excess demand and above equilibrium there is excess supply; description: Two exact demand P12 minusQ and supply P2 plusQ panels with E Q5 P7, reference P4 showing Qs2 Qd8 shortage6 and P10 showing Qd2 Qs8 surplus6.]
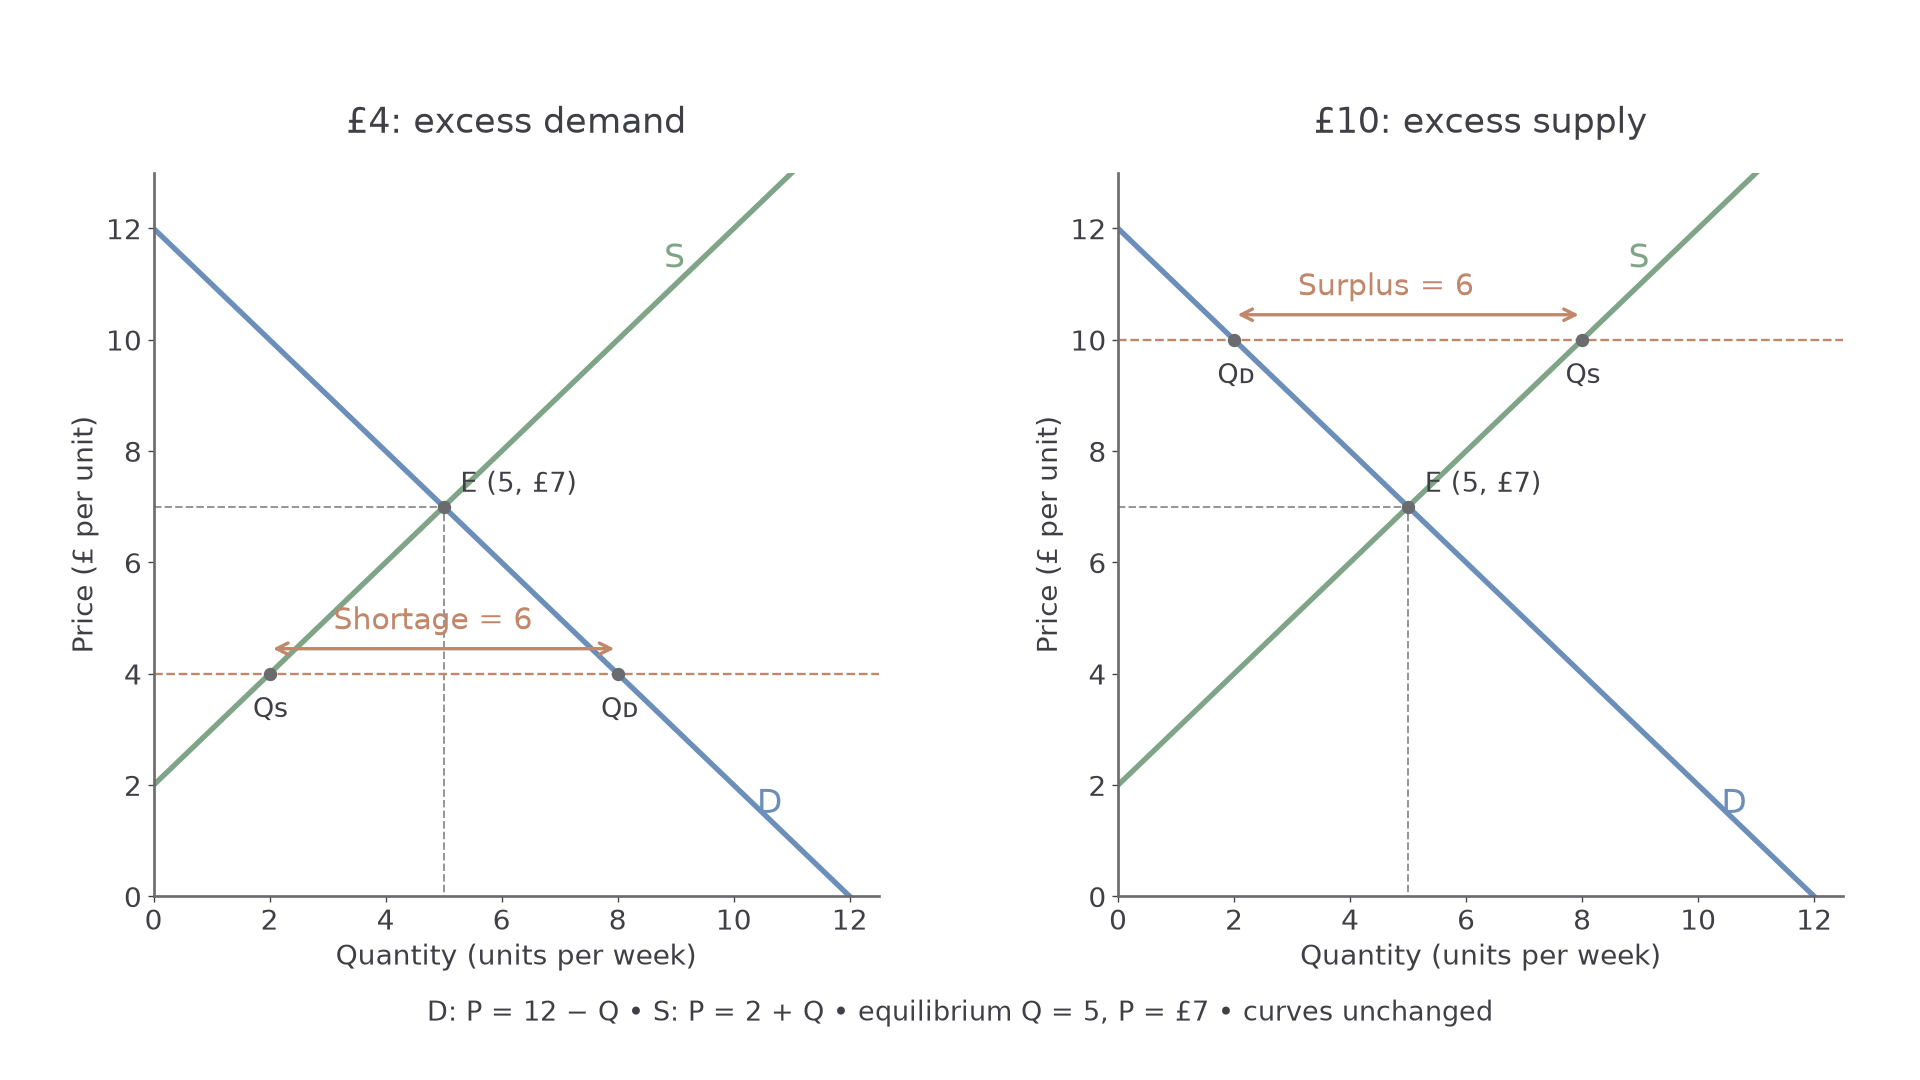
The equilibrium is the common point (5 units, £7). The two panels examine different prices away from it, with both curves unchanged.
Equilibrium means no excess demand or supply in this model, not that every want is met or that the allocation is fair. People unable to pay may not purchase. Unpriced harm or poor information can also prevent a market-clearing outcome from being socially desirable. Equilibrium is a coordination concept, distinct from a judgement about social efficiency.
Shortages and surpluses
Disequilibrium means the quantities buyers and sellers plan at the prevailing price do not match.
At £4 in the plotted market, demand is units and supply is . Excess demand, or a shortage, is units. Some buyers cannot obtain the good at that price. Where prices can adjust, buyers' willingness to bid more and sellers' ability to charge more create upward pressure. The higher price contracts quantity demanded and extends quantity supplied until they coincide.
At £10, supply is 8 and demand is 2. Excess supply, or a surplus, is six units. Unsold output can encourage sellers to lower price. A lower price extends quantity demanded and contracts quantity supplied towards equilibrium. The market price is the vertical variable causing these movements; the curves do not shift merely because the price adjusts.
Adjustment is conditional. Prices may be fixed by contracts or regulations, firms may wait before changing them, production may take time and buyers may not know availability. A shortage may therefore persist or be rationed through queues rather than immediately disappear. A supply curve records quantities offered; actual sales cannot be assumed equal to the larger of demand and supply when their plans differ.
For example, an illustrative venue may have only 100 seats at a low fixed admission price and 140 willing buyers. The 40-seat excess demand does not make 140 sales physically possible. A higher price may reduce demand without expanding that evening's fixed seating capacity. The general adjustment mechanism still applies, but the supply conditions determine how the quantities respond.
Shifts and new equilibria
A shift changes the quantities planned at each price and therefore changes the intersection of demand and supply.
With supply unchanged, a rightward demand shift creates excess demand at the old price. Price rises, quantity supplied extends along S and equilibrium quantity increases. A leftward demand shift reduces both equilibrium price and quantity. With demand unchanged, a rightward supply shift creates excess supply at the old price: price falls and quantity demanded extends along D. A leftward supply shift raises equilibrium price and reduces quantity.
[DIAGRAM: asset_slug: h460-foundations-equilibrium-shifts; caption: An increase in demand raises price and quantity, while an increase in supply lowers price and raises quantity; description: Exact illustrative panels initial D P12 minusQ S P2 plusQ E0 Q5 P7, demand D1 P14 minusQ E1 Q6 P8, and supply S1 P Q E1 Q6 P6.]
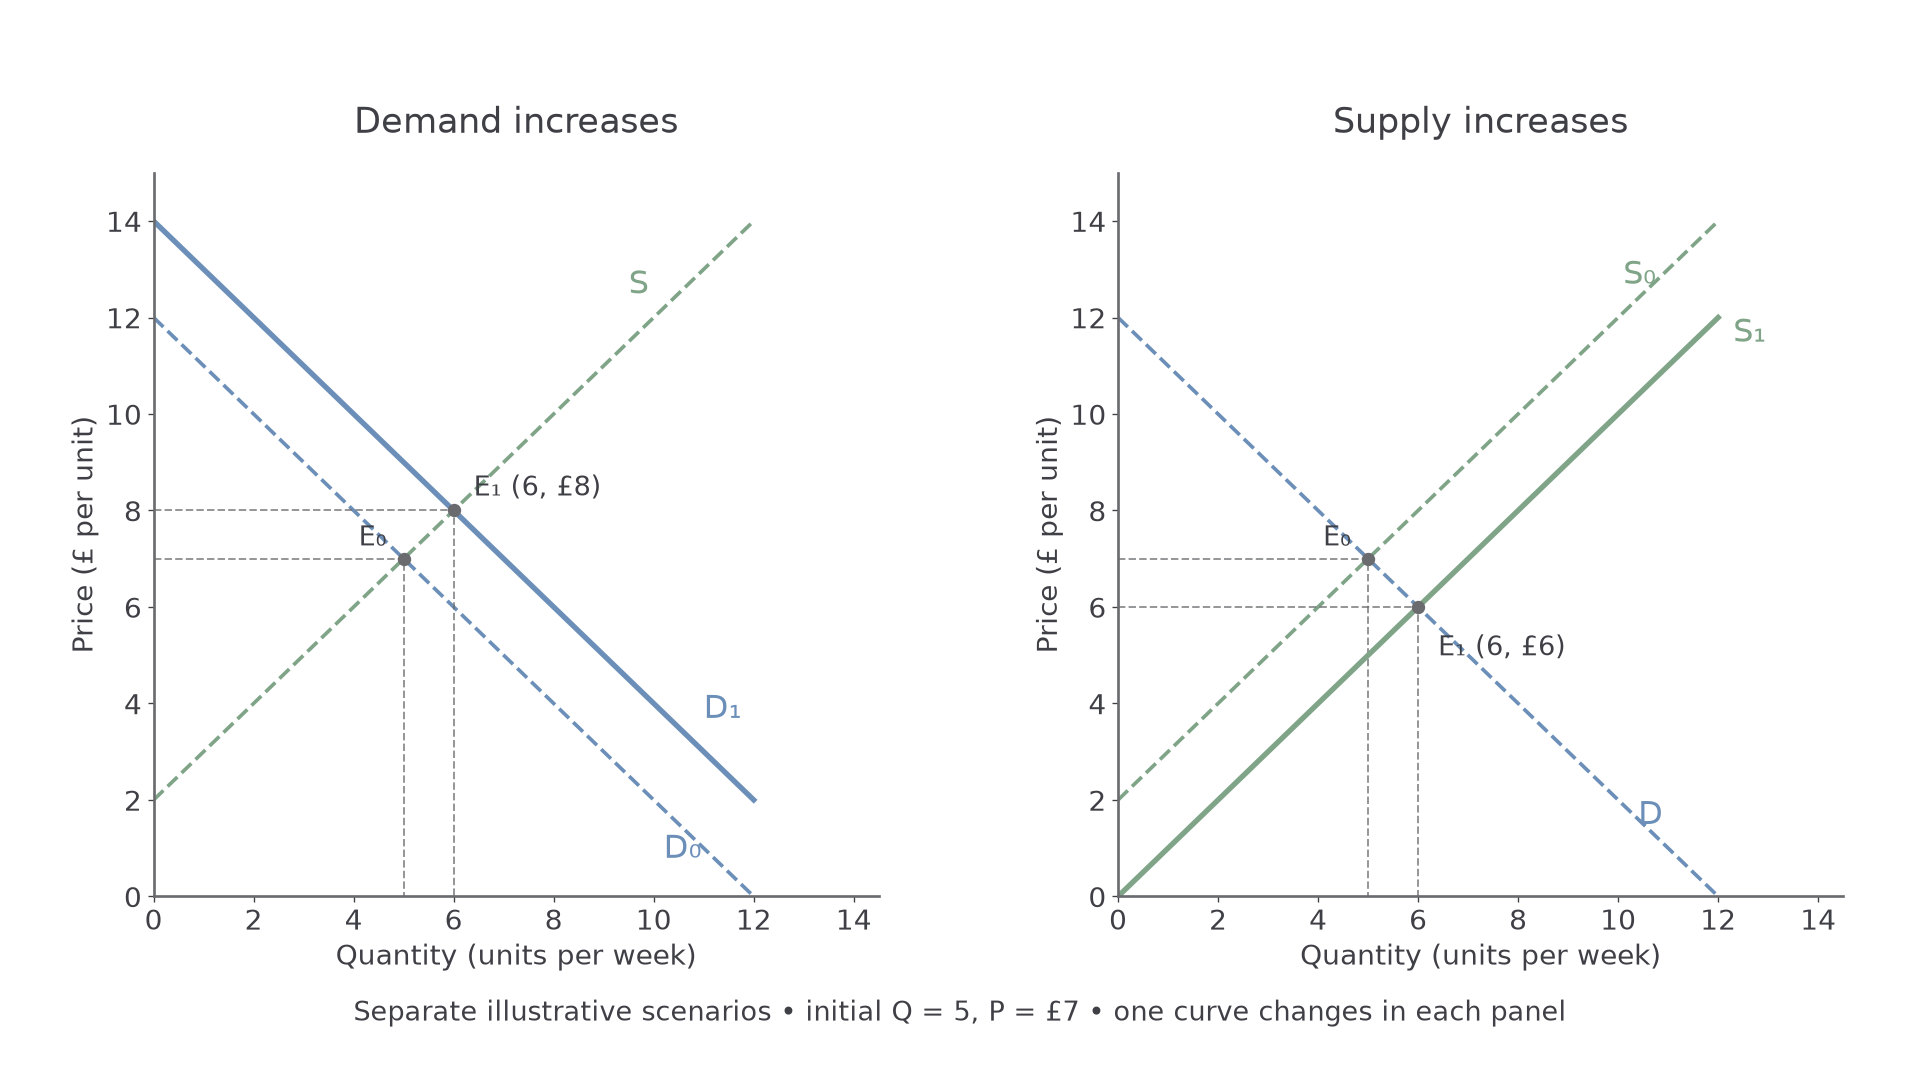
Each panel changes one relationship and holds the other unchanged. D1 and S1 belong to separate scenarios.
In the demand scenario, gives Q6, P8. In the supply scenario, gives Q6, P6. These confirm the diagram's directions. Draw the old curves and equilibrium first, add only the changed curve, label the new intersection and project its price and quantity to the axes. Arrows on a shifted curve indicate the change in the relationship; movements along the other curve show adjustment.
If demand and supply both increase, equilibrium quantity rises but price is ambiguous: the demand shift pushes it up and the supply shift pushes it down. Their relative sizes determine the outcome. If demand increases while supply decreases, price rises but quantity is ambiguous. Do not choose an ambiguous result without information about shift sizes or a suitable condition. Comparing price alone cannot identify which curve changed.
Effects in connected markets
A change in one market can alter demand or supply in another, but the direction follows the particular economic relationship.
Suppose an illustrative supply improvement makes train journeys cheaper. With train demand unchanged, their equilibrium price falls and quantity increases. Some travellers switch from substitute bus journeys, shifting bus demand left. With bus supply unchanged, bus equilibrium price and quantity tend to fall. Demand for a complementary station car park may rise if more train passengers drive to the station, but not if the extra passengers walk or transfer from a bus. The connection must fit the users and location.
Production links work differently. An increase in beef demand can raise cattle output and increase the supply of jointly produced hides, tending to reduce hide prices if hide demand is unchanged. A more profitable wheat crop can draw land away from barley, reducing barley supply and tending to raise barley prices. Distinguish the first market's shift and price adjustment from the second market's own relationship change.
The effects depend on substitution, capacity and time. A bus route serving places without a railway may lose few passengers; a connected route may lose many. Over a longer period, operators could reduce routes or capacity, shifting bus supply left and modifying the initial fall in price. Simultaneous changes in income, fuel costs or preferences can strengthen or offset the first effect. Ceteris paribus gives a clear first prediction; evaluation identifies the actual condition most likely to change it.
Consider a rail improvement where most bus users lack convenient station access. The substitute link is weak, so predicting a large bus-demand fall is poorly supported. If bus and rail directly compete on the same commuter route with comparable times and access, the prediction is stronger. A defensible judgement therefore specifies the related market, explains the chain and uses evidence about the link rather than asserting that all connected markets move together.
Quick recap
Equilibrium matches planned demand and supply; shortages and surpluses create conditional pressure for adjustment. A shift moves the intersection, while an own-price change moves along a curve. Follow a specific substitute, complement or production link across markets, and qualify results where conditions or simultaneous shifts make them uncertain.