5.2 - Harrod-Domar, microfinance and development
The Harrod-Domar model explains one route from saving to productive capacity, while microfinance addresses financial access at household and small-business level. Learn to calculate the model's predictions and judge when either approach can improve development.
The capital-growth mechanism
The simplified Harrod-Domar model links growth to the share of income saved and the amount of capital needed to produce extra output.
Let annual real output be , saving be , and the saving ratio be . A 20% saving ratio is 0.20 in a formula. Let be the capital-output ratio: the amount of capital needed for each unit of annual output. In the simplified fixed-proportions model, the same ratio applies at the margin, so . A ratio of 4 means four units of additional capital support one unit of additional annual output, using compatible base-price measures.
Assume saving is converted into productive net investment, so . Assume capital is used fully and the capital-output ratio is constant. Then . Dividing by existing output gives the predicted output-growth rate:
Simplified Harrod-Domar prediction
Use as a fraction and convert into a percentage at the end. This form treats investment as net of depreciation or assumes depreciation is zero.
The causal story is saving → investment → more capital → greater productive capacity → higher output and income. Low income can restrict saving, limiting capital accumulation and keeping income low: a possible poverty trap. Better finance or external funds may help break that constraint. This is one mechanism, not a complete account of poverty: skills, institutions, health, demand and distribution also matter.
The formula concerns potential growth under its assumptions. It does not say that a household saving more next month immediately raises national output. Nor does it say that a higher capital-output ratio is desirable: a larger v means more capital is required for the same extra output.
Calculating and comparing predictions
The model predicts faster growth when the saving ratio rises or when capital produces more additional output per unit invested.
Take an illustrative economy with output of £100 billion at base-year prices, a saving ratio of 18% and v = 3. Saving and assumed productive net investment are £18 billion. Predicted additional annual output is billion, giving growth of . A ratio describes scale: the £18 billion investment is three times the £6 billion extra annual output.
If the saving ratio rises to 21% with v still 3, predicted growth becomes 7%. That is a rise of one percentage point, or a 16.7% rise in the growth rate relative to 6%. Alternatively, keep saving at 18% but reduce v from 3 to 2: predicted growth becomes 9%. A lower v could represent better project selection or more effective capital use, subject to the model's fixed-ratio assumptions.
[DIAGRAM: asset_slug: ocr_h460_harrod_domar_predictions; caption: Higher saving raises predicted growth, while a larger capital-output ratio lowers it for a given saving rate; description: Exact illustrative lines for g percent equal to saving percent divided by v, with saving rate percent on the horizontal axis and predicted annual real-output growth percent on the vertical axis; v values 3, 4 and 6, and values at saving 18% marked.]
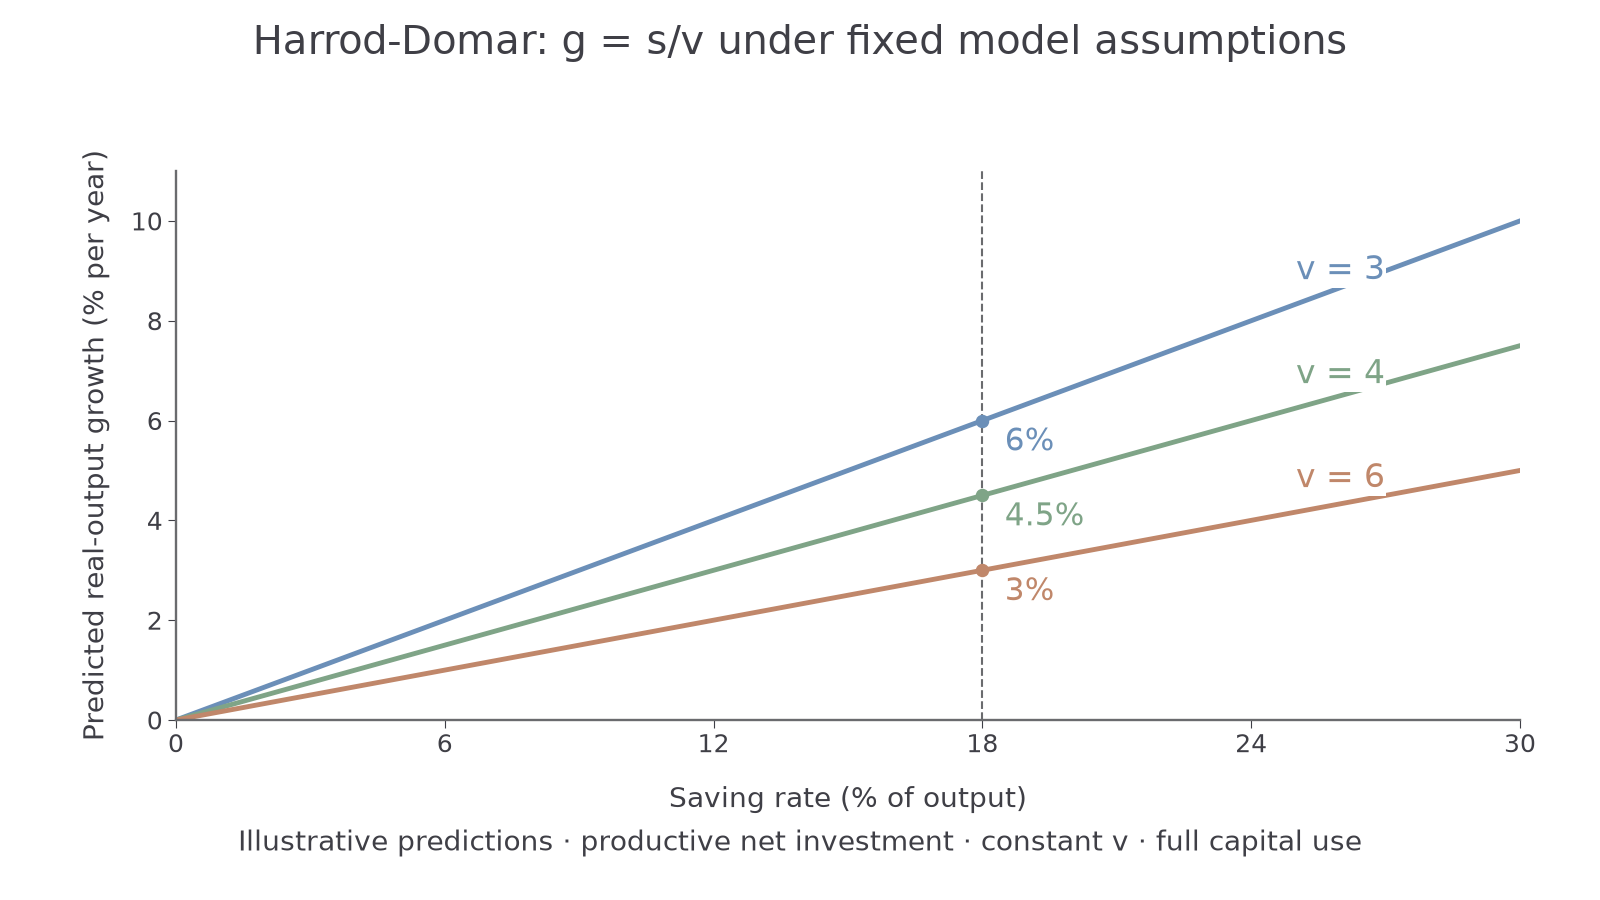
The graph is a family of conditional predictions, not observed data or proof of causation. Every point assumes that saving becomes effective net investment and other conditions hold. To reconstruct it, calculate g for several saving rates under one fixed v, plot the paired percentages, and repeat for another v. Interpretation of the supplied graph is distinct from assessing your own drawn graph.
If saving finances gross investment, some investment replaces worn-out capital. With a depreciation rate applied to existing capital and the same fixed-ratio assumptions, the extension is . For s = 18%, v = 3 and depreciation of 2% of capital each year, net growth is 4%, rather than 6%. Use the no-depreciation formula when the question states it; do not silently subtract depreciation from a net-investment figure.
Why predicted growth may not occur
The model is useful for identifying a financing gap, but its output prediction depends on how investment is selected and used.
First, saving need not become productive domestic investment. Funds may be held idle, used to buy existing property or sent overseas. Corruption or poor lending decisions may finance projects with low social returns. External aid or foreign investment can increase available funds, but borrowing creates repayment obligations and an exchange-rate risk if debt is denominated in foreign currency.
Second, capital productivity is not fixed. A road with little traffic, equipment without spare parts or an irrigation system without reliable water yields less output than expected. Training, technology and maintenance can change v. The model suppresses substitution between inputs and does not explain those changes itself. More machines are not sufficient when skills or electricity are missing.
Third, capacity need not be fully used. A factory without buyers may produce below its potential. Raising saving by cutting consumption can weaken demand in the short run, so a capacity calculation is not a complete prediction of actual output. Population growth also matters: if output grows 4% and population grows 3%, exact output-per-person growth is , not 4%.
Continue this lesson.
You’re previewing NovaLearn without an account. Create a free account to read the rest.
Create free account