4.2 - Price discrimination and natural monopoly
Why can the same service have different prices for different customers, and why can splitting one network into competing firms raise costs? This part of 4.2 explains price discrimination and natural monopoly using revenue and cost diagrams. It then compares the distribution, access and incentive effects of different pricing arrangements.
When different prices are possible
Price discrimination means charging different prices for the same good or service when the difference is not explained by different costs of supply.
A higher price for an expensive delivery route may reflect cost rather than discrimination. A cinema charging different ticket prices to adults and students for the same screening is a clearer illustrative case. The comparison must account for quality, timing and supply costs before concluding that a price difference reflects market power.
Three conditions enable discrimination. The seller needs some market power, rather than facing identical rivals that force one price. It must identify buyers or transactions with different willingness to pay or responsiveness. It must prevent resale or arbitrage, where a buyer purchases cheaply and resells to a higher-price buyer, undermining the separation. Personal identification can support student prices; a service consumed at the time of purchase is often difficult to resell.
Common forms are charging each buyer close to their maximum willingness to pay, offering a menu of quantities or versions that induces different buyers to select differently, and separating groups such as students and adults. These are conventionally called first-, second- and third-degree discrimination. A pricing menu counts only insofar as its price differences exceed cost differences; not every quantity discount does so.
Suppose an illustrative theatre charges students £8 and other adults £14. Verification of student status prevents an adult purchasing a student ticket, and tickets cannot be transferred. If students have closer alternatives or tighter budgets, their demand may be more price elastic. The group labels alone do not prove these responses: the theatre needs evidence of actual demand conditions.
Output and price in separate markets
A profit-maximising discriminator allocates sales so that marginal revenues in the separate markets equal the marginal cost of the combined output.
If MR in market A exceeded MR in market B, moving a unit of sales towards A would increase revenue. With separable markets, the optimum has , subject to feasible sales and capacity. MC refers to the cost of the firm's total output; it is not two unrelated cost schedules. A horizontal constant MC is a useful simplified case because that cost applies to both markets.
[DIAGRAM: asset_slug: h460-discrimination-segments; caption: With constant MC, separate MR intersections determine quantities and AR determines each price; description: Two exact illustrative segmented markets have constant MC 4, market A AR 16 minus Q and market B AR 12 minus 0.5Q; the optimum is QA 6 at price 10 and QB 8 at price 8.]
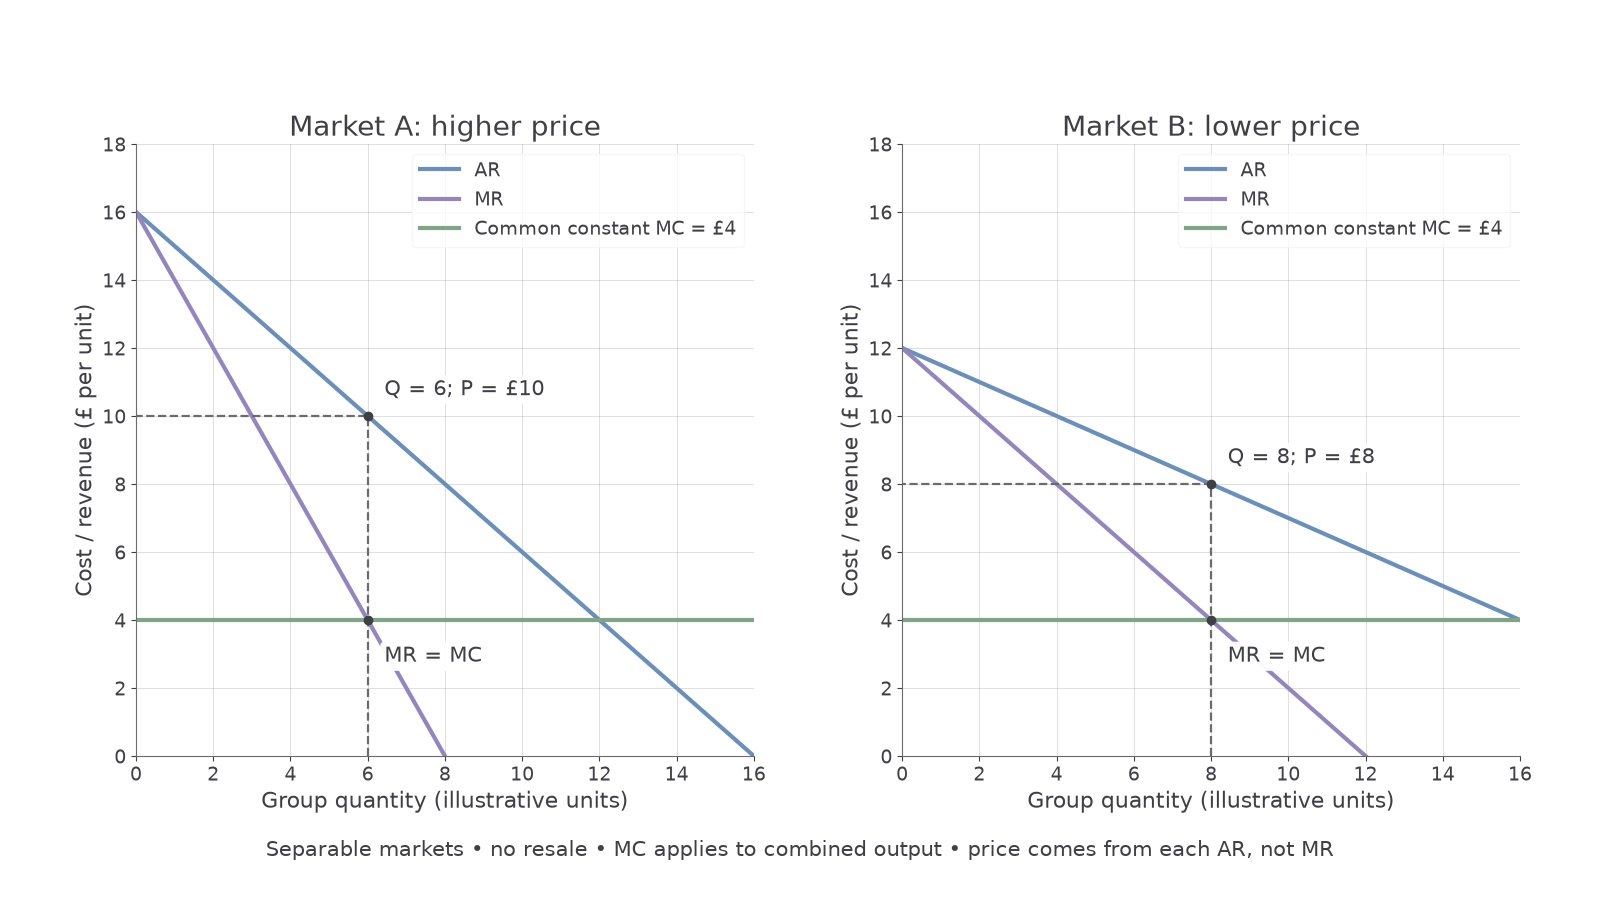
In market A, and . In B, and . With MC=£4, set each MR equal to £4: A sells 6 units at £10 and B sells 8 at £8. Prices are read from AR, not MR. TR is . Variable cost is ; contribution towards fixed cost and profit is £68. Subtract any fixed cost before claiming total economic profit.
The price ratio is : A pays one and a quarter times B's price, or 25% more relative to B. B's price is 20% lower relative to A; different percentage bases explain the difference. A's local demand is less elastic in magnitude at its chosen price than B's, consistent with the higher price in the standard discrimination model.
For a notebook diagram, use the same cost/revenue units in both panels. Label AR and MR separately, draw constant MC, find each quantity at MR=MC and carry it up to the corresponding AR. Two prices alone are not enough: the diagram must show the different demand conditions and the pricing decision.
Who gains from discrimination?
The welfare effect of price discrimination depends on who pays, whether total output changes, and the feasible alternative.
The producer can capture more consumer surplus, the difference between willingness to pay and the price actually paid. A less responsive group may face a higher price than under uniform pricing, losing surplus or access. A more responsive group may gain a lower price and buy units that would not have been sold at the uniform price. Higher producer profit is partly a transfer from consumers, not automatically a gain in total welfare.
Continue this lesson.
You’re previewing NovaLearn without an account. Create a free account to read the rest.
Create free account