3.1 - Taxation and the government budget
A government's budget brings together the money it receives and the spending it plans. Learn how to classify taxes and spending, calculate budget balances and tax rates, and explain why changing a tax rate need not change revenue in the same proportion.
The budget and public spending
The government budget is a statement of planned public receipts and expenditure over a period, normally a year.
Receipts include taxes and non-tax income, such as charges for some services. Expenditure includes public purchases, transfers and interest on government borrowing. Forecast receipts may differ from actual receipts because employment, profits and spending change. A budget is a plan, not a guarantee of its eventual outturn.
Current expenditure pays for recurring services and transfers: nurses' salaries, school running costs, pensions and debt interest are examples. Capital expenditure purchases or improves lasting assets, such as a new hospital building, railway or flood defence. Repairing a road is normally current maintenance; building a new road creates an asset. The economic substance matters more than whether spending sounds important.
Capital spending can increase future productive capacity, but a badly located railway may offer little benefit. Current spending on teachers can improve skills and productivity. Therefore capital is not automatically productive and current is not automatically wasteful. Both have an opportunity cost because labour, materials and funds could be used elsewhere.
Keep public spending separate from the G component of aggregate demand. Buying newly produced medical services contributes to G. A pension transfer is not itself payment for newly produced output; when its recipient buys goods, that spending contributes to C. Interest payments similarly affect recipients' incomes without becoming direct government purchases of new output.
For an illustrative annual budget, suppose tax receipts are £240bn, other receipts £10bn, current expenditure £230bn and capital expenditure £40bn. Total receipts are £250bn and total expenditure £270bn. Borrowing can finance the £20bn gap; borrowing is financing, rather than a tax receipt that removes the deficit.
Two ways to classify taxes
Taxes can be classified by what is taxed and by how their burden changes with income.
A direct tax is charged on income, profits or wealth, such as income tax or a tax on company profits. An indirect tax is charged on expenditure on goods and services, such as a sales tax or a duty on fuel. A firm may remit an indirect tax to government, but who ultimately bears its economic burden depends on supply and demand elasticities. The legal payer and the economic bearer need not be the same.
The second classification concerns the proportion of income paid in tax. A progressive tax takes a rising average percentage as income rises. A proportional tax takes a constant average percentage. A regressive tax takes a falling average percentage. These definitions concern proportions, not simply whether a richer person pays more pounds.
In an illustrative proportional system, someone earning £20,000 pays £4,000 and someone earning £40,000 pays £8,000: each pays 20%. The second person pays more money, but not a higher proportion. A fixed £1,000 annual charge takes 5% of £20,000 and 2.5% of £40,000, so it is regressive relative to income.
These are two separate classifications: direct does not mean progressive. A flat tax on all income can be direct and proportional; a direct fixed charge can be regressive. An indirect tax on essential purchases may be regressive relative to household income because low-income households spend a greater income share on those purchases. Its distributional effect nevertheless depends on exemptions, consumption patterns and the rest of the tax-and-benefit system.
Progressive taxation can reduce disposable-income inequality, other things equal. High marginal rates may weaken some incentives or encourage avoidance, while tax-funded services can improve opportunities. Classification identifies a structure; it does not establish whether that structure is desirable in every situation.
Average and marginal tax rates
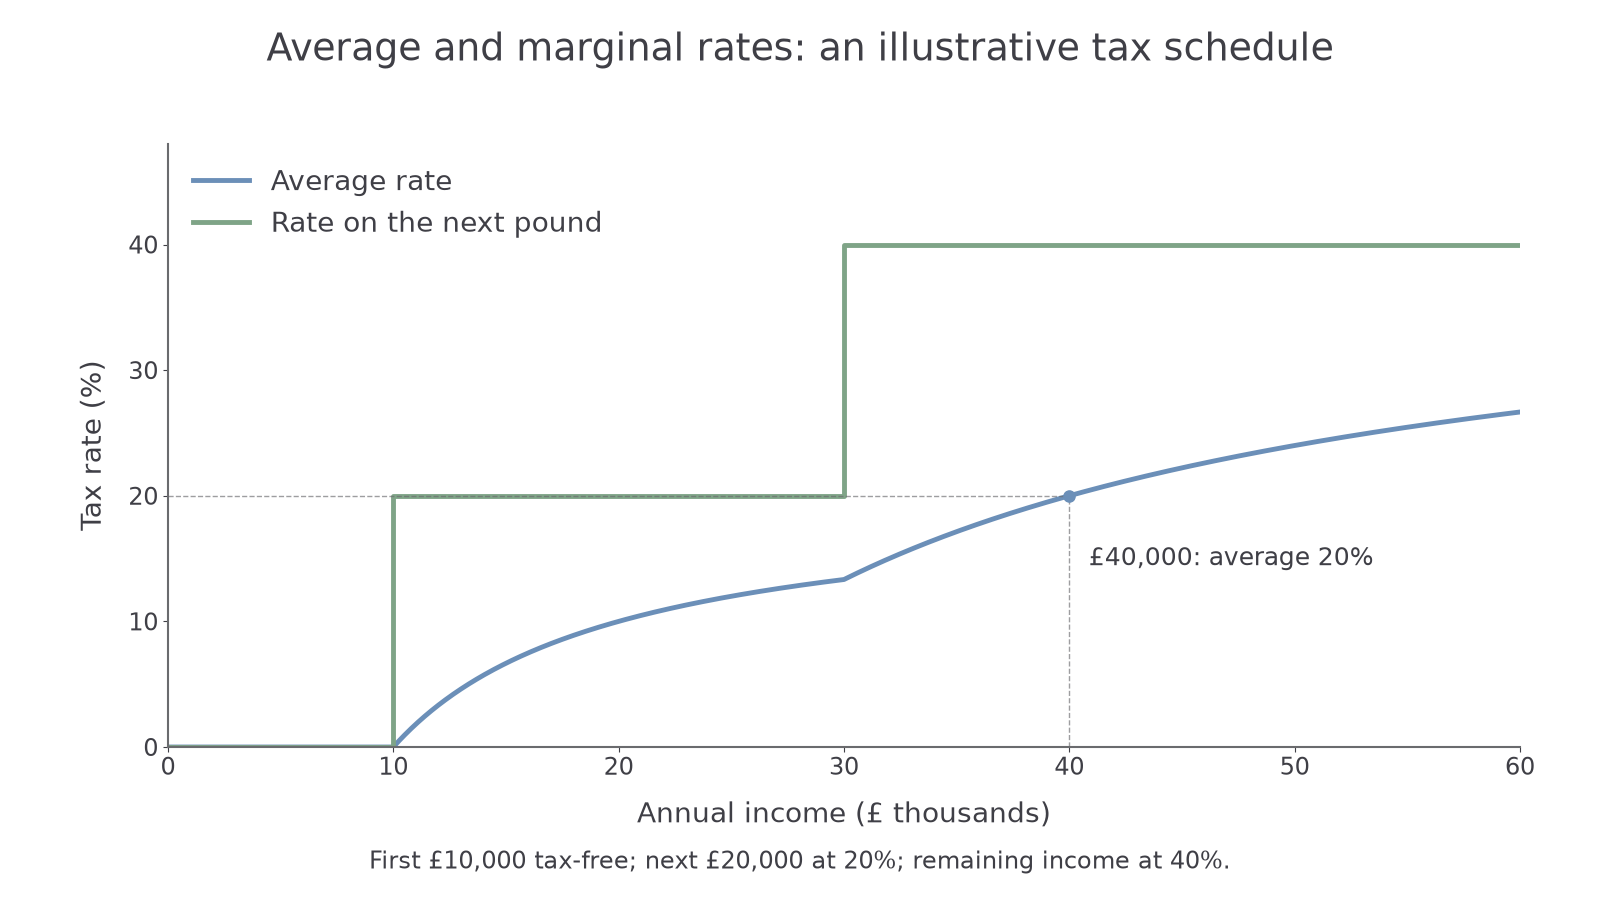
An average tax rate measures the overall burden, while a marginal tax rate measures the tax on an additional amount of income.
The marginal rate on the next pound is the rate in the applicable band. A ratio over a larger income increase that crosses bands is an average marginal burden over that increase, not necessarily the rate on its last pound.
Consider this invented annual income-tax system, with no other taxes or benefits: the first £10,000 is tax-free; income above £10,000 up to £30,000 is taxed at 20%; income above £30,000 is taxed at 40%. Each rate applies only to income in its band.
For income of £40,000, tax is . The average rate is . The marginal rate on the next pound is 40%. Applying 40% to the entire £40,000 would incorrectly erase the lower bands.
| Annual income | Total tax | Average rate | Rate on the next pound |
|---|---|---|---|
| £20,000 | £2,000 | 10% | 20% |
| £30,000 | £4,000 | 13.33% | 40% |
| £40,000 | £8,000 | 20% | 40% |
[DIAGRAM: asset_slug: ocr_h460_average_marginal_tax; caption: Average and marginal rates differ in an illustrative banded income tax; description: Exact graph of the stated invented tax schedule, with average rate continuous and marginal rate stepping from 0% to 20% to 40%.]
Continue this lesson.
You’re previewing NovaLearn without an account. Create a free account to read the rest.
Create free account