2.8 - Externalities and welfare
A transaction can affect people who neither buy nor sell the product. In 2.8, you will distinguish private and social costs and benefits, use diagrams to explain production and consumption externalities, and locate the welfare lost when the market produces the wrong quantity. The aim is to explain the missing incentive, not simply to label an activity good or bad.
Private and social accounts
An externality occurs when an economic activity affects third parties and that effect is not fully reflected in the market transaction.
The private cost is borne by the decision-maker, such as a firm's wages, materials and energy payments. An external cost is imposed on others without compensation through the transaction: a factory's emissions may worsen residents' health. The factory can consider its fuel bill while overlooking that damage when deciding output.
The private benefit accrues to the buyer or producer making the decision. An external benefit reaches third parties without a matching payment: a person's vaccination can reduce infection risks for others. Private and external effects together make the social account. An externality is not simply a large private cost, and every price change affecting someone else is not automatically an externality.
We use marginal measures because the output decision concerns one more unit. Marginal private cost (MPC) is the additional cost borne by the producer or decision-maker. Marginal external cost (MEC) is the additional cost imposed on third parties. Marginal social cost (MSC) includes both:
Similarly, marginal private benefit (MPB) is the additional benefit to the decision-maker, marginal external benefit (MEB) is the additional benefit to third parties, and marginal social benefit (MSB) includes both:
For example, an illustrative unit of factory output costs the producer £4 and imposes £2 of damage on neighbours. Its marginal social cost is £6. If one additional training place benefits the trainee by £80 and other people by £20, its marginal social benefit is £100. These are marginal values per additional unit, not the total cost or benefit of the whole industry.
Market failure means the market allocates resources inefficiently. In this model, the efficient quantity is where MSB equals MSC: for units below that quantity, the extra social benefit exceeds extra social cost; for units beyond it, extra cost exceeds extra benefit. A competitive market instead balances the private incentives, MPB and MPC. If it overlooks an external effect, the two quantities can differ and total net social benefit is lower than it could be.
The diagrams below isolate one externality at a time. Production externalities are placed in the cost account; consumption externalities are placed in the benefit account. With a harmful consumption effect, MSB is the private benefit less external damage. This is a net-benefit representation of the cost: do not add the same damage to MSC as well, which would count it twice.
Negative production externalities
A negative production externality makes the social cost of another unit greater than the cost the producer pays.
Consider an illustrative production process whose emissions damage nearby residents. The firm sees its own marginal production costs, so the market supply curve is MPC. Adding marginal pollution damage places MSC above MPC. Assume there is no consumption externality, so demand represents both MPB and MSB.
[DIAGRAM: asset_slug: h460-negative-production; caption: Unpriced production damage raises MSC above MPC and makes market output exceed efficient output; description: Exact illustrative negative production externality graph with MPB equals MSB 12 minus0.4Q, MPC2 plus0.4Q, MSC4 plus0.4Q, Qs10 and Qm12.5 thousand units weekly, and the welfare-loss triangle between10 and12.5.]
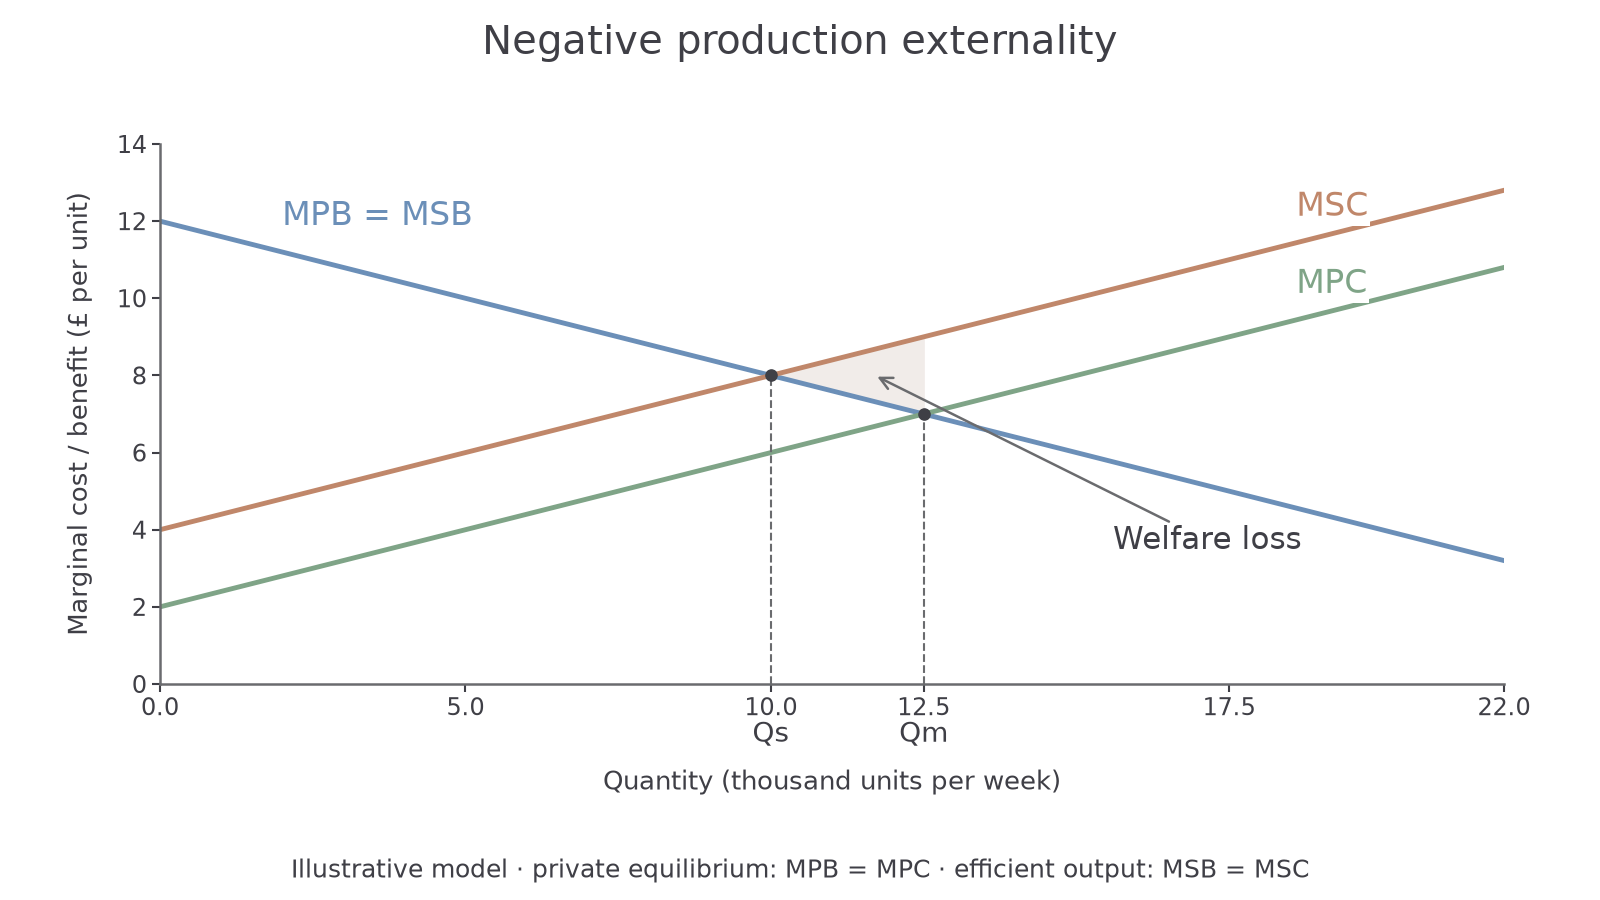
All values are illustrative. Quantity is thousands of units per week and marginal values are pounds per unit. External damage is £2 for each extra unit.
The private market equilibrium is thousand, where MPB equals MPC at £7 per unit. The efficient quantity is thousand, where MSB equals MSC at £8 per unit. Unpriced damage makes the product appear cheaper to supply than it is for society, so the market produces 2,500 units too many.
For each unit between and , MSC exceeds MSB. Reducing these units would save more social cost than it sacrifices social benefit. The shaded triangle adds those net losses. It is deadweight welfare loss, the reduction in total net social benefit relative to the efficient quantity. It is not the entire external damage rectangle: external damage can remain even at efficient output, because some production still generates benefits greater than its full costs.
Here the triangle has a base of 2,500 units and a height of £2 per unit at . Its area is per week. The units matter: multiplying a horizontal quantity measured in thousands directly by a pound value gives thousands of pounds.
Constructing the diagram
Start with quantity on the horizontal axis and marginal costs and benefits on the vertical axis. Draw an upward MPC and a downward MPB = MSB. Then draw MSC above MPC by the external cost. Mark the private intersection , the social intersection , and shade only the area between MSC and MSB over the excess-output interval. State the assumptions that make these labels appropriate.
Notebook practice (ungraded): reconstruct this graph and label its market quantity, efficient quantity and welfare-loss area. This practices drawing on paper. A written description in the app can assess your interpretation, but it cannot establish that you drew the required curves and area.
Consumption spillovers
A consumption externality creates a gap between the benefit considered by the buyer and the net benefit of consumption for society.
With a negative consumption externality, the consumer receives a private benefit but other people suffer damage. For example, loud late-night activity can disturb people outside the transaction. Represent the damage by placing net MSB below MPB. If there is no production externality, MPC equals MSC.
[DIAGRAM: asset_slug: h460-negative-consumption; caption: Harmful consumption places net MSB below MPB and leads to excessive consumption; description: Exact illustrative negative consumption externality graph with MPB12 minus0.4Q, MSB10 minus0.4Q, MPC equals MSC2 plus0.4Q, Qs10 and Qm12.5 thousand units weekly, and welfare loss between10 and12.5.]
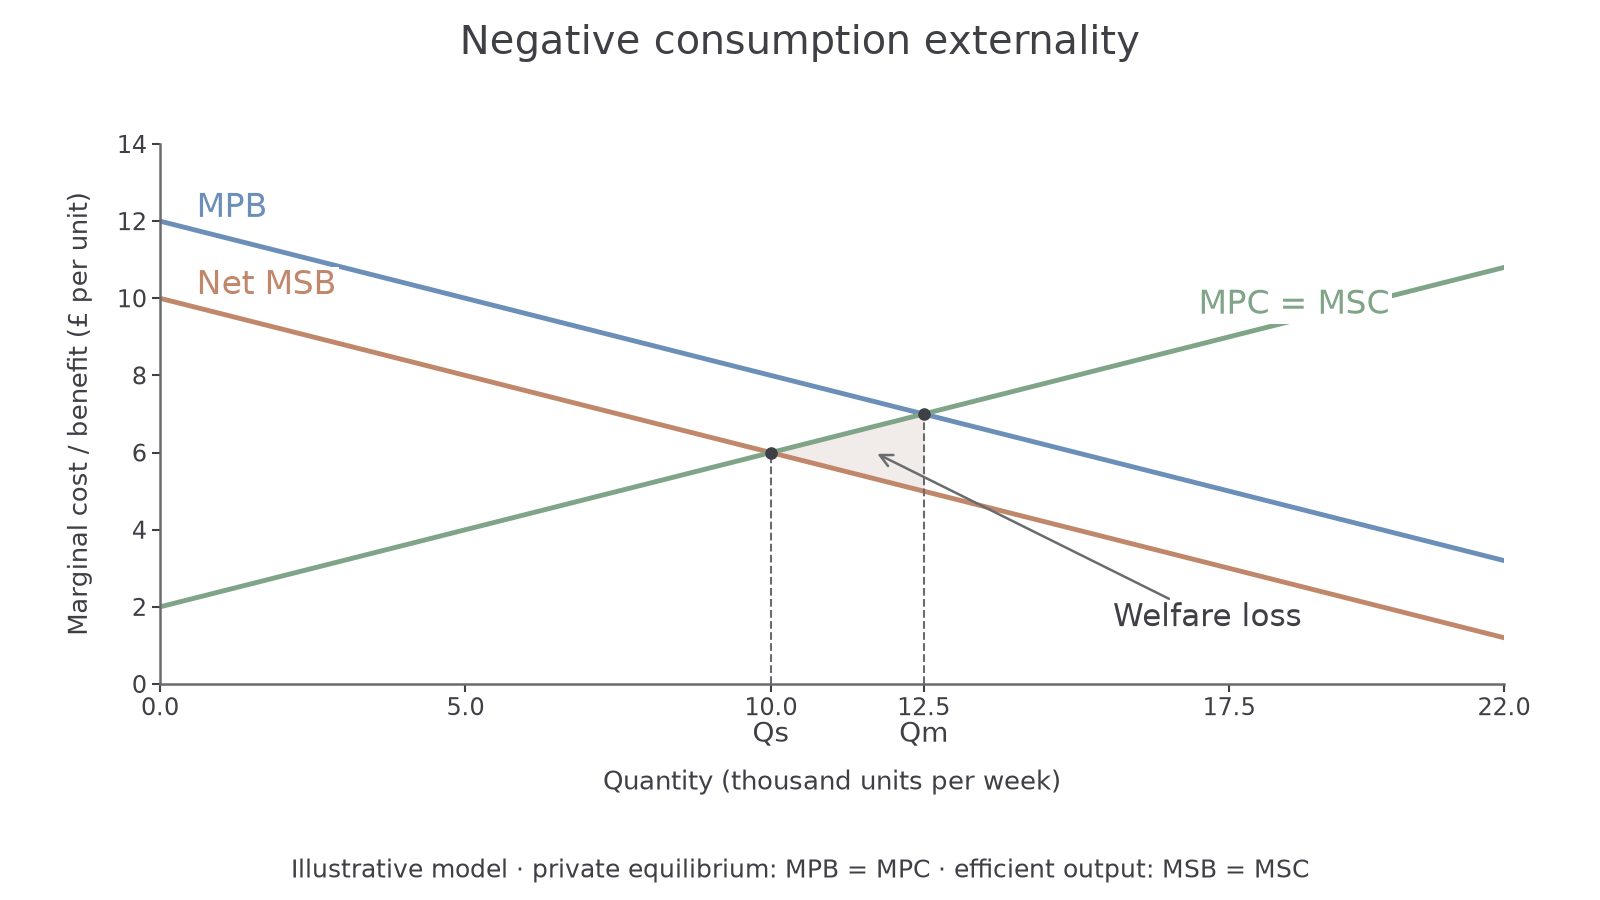
This illustrative model deducts £2 of external damage per additional unit from private benefit. It does not also add that same damage to costs.
The buyer's MPB intersects supply at 12.5 thousand units, while net MSB intersects MSC at 10 thousand. The additional units beyond 10 thousand cost society more than their net social benefit, so consumption is excessive and the triangle lies between MSC and MSB. In this case the missing consideration is the effect of consuming the product, whereas the preceding graph represented damage from producing it.
With a positive consumption externality, other people benefit from the buyer's action. Vaccination is an example when it reduces transmission to others. Add the external benefit to MPB to place MSB above MPB.
[DIAGRAM: asset_slug: h460-positive-consumption; caption: Beneficial consumption places MSB above MPB and makes market consumption lower than efficient consumption; description: Exact illustrative positive consumption externality graph with MPB10 minus0.4Q, MSB12 minus0.4Q, MPC equals MSC2 plus0.4Q, Qm10 and Qs12.5 thousand units weekly, and missing welfare gains between10 and12.5.]
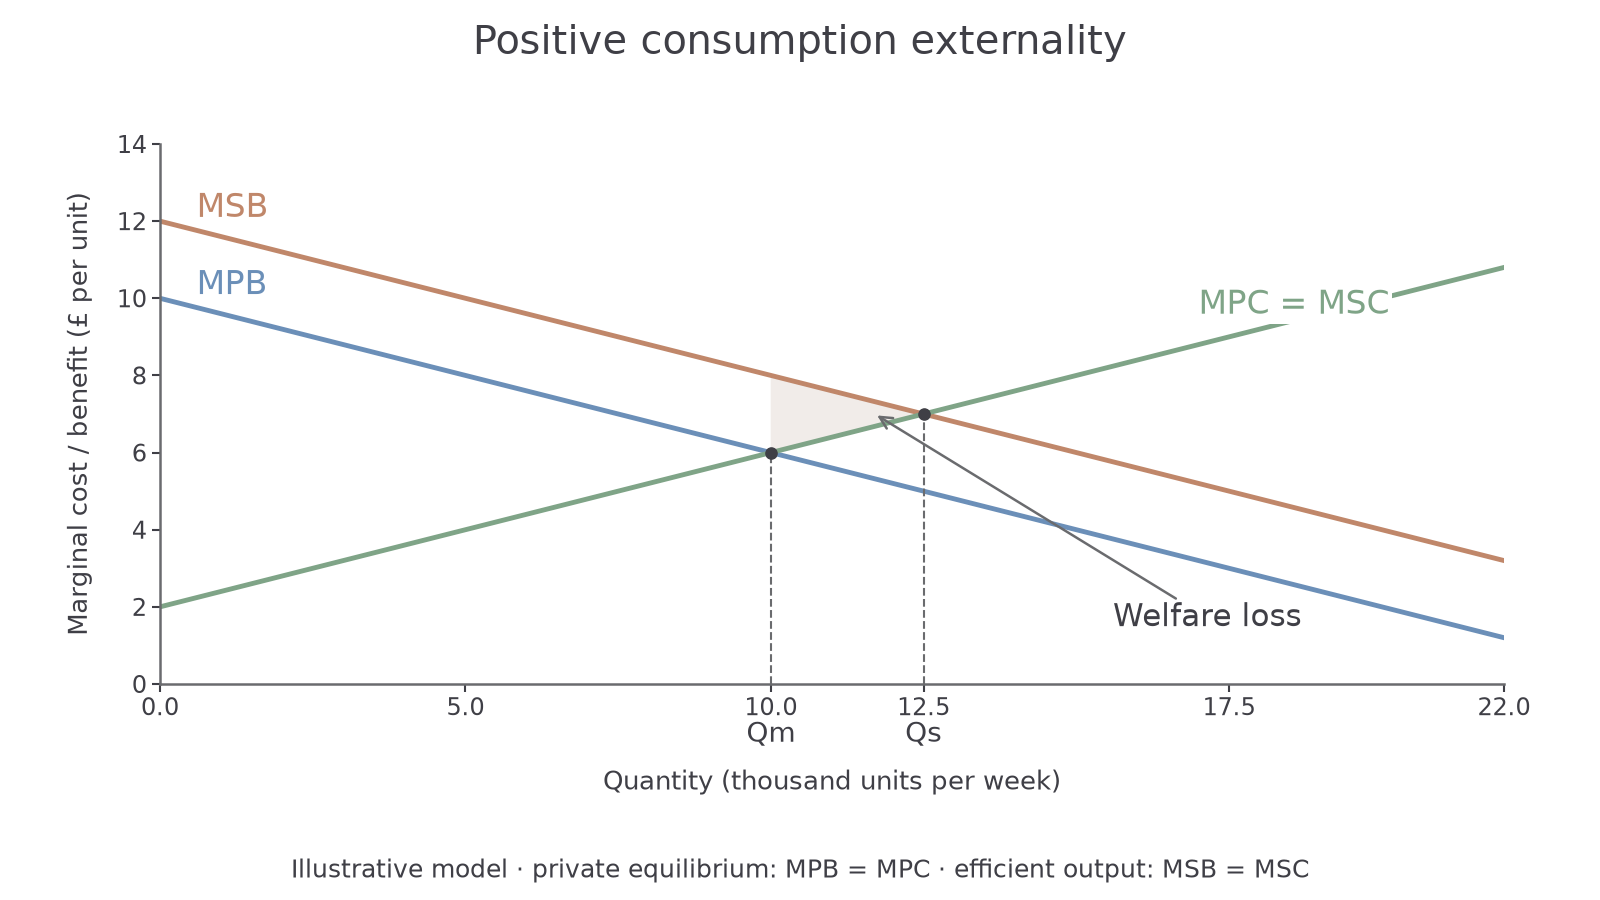
The illustrative external benefit is £2 per additional unit. The efficient quantity is 12.5 thousand, compared with a private market quantity of 10 thousand.
The consumer may stop buying when their own extra benefit falls to the price, even though the extra social benefit remains above the social cost. Between and , additional consumption would generate a net social gain. The triangle measures the gain forgone through underconsumption, not a harm generated by those missing units.
These are externality models, not information-failure models. A fully informed buyer can still ignore a benefit to someone else. Conversely, underestimating a private health benefit is a separate information problem, developed in 2.9. An activity can involve both, but identify which effect each curve represents before drawing or explaining it.
Positive production externalities
A positive production externality occurs when producing a good creates an uncompensated benefit for other people.
For example, a firm may train workers whose improved skills later benefit other employers, or production research may generate knowledge that other firms can use. The initial producer bears a private cost without receiving payment for all of the benefits created. These are possible mechanisms: whether an actual activity has this spillover depends on who gains and whether payment already captures it.
In the cost-account representation, subtract the external production benefit from MPC to obtain net MSC. MSC is below MPC. Assume no consumption externality so MPB = MSB. This lower social cost does not mean the firm receives cheaper inputs: its private supply curve remains MPC unless incentives change.
[DIAGRAM: asset_slug: h460-positive-production; caption: Beneficial production lowers net MSC below MPC and leaves market output below efficient output; description: Exact illustrative positive production externality graph with MPC4 plus0.4Q, net MSC2 plus0.4Q, MPB equals MSB12 minus0.4Q, Qm10 and Qs12.5 thousand units weekly, and forgone welfare gains between10 and12.5.]
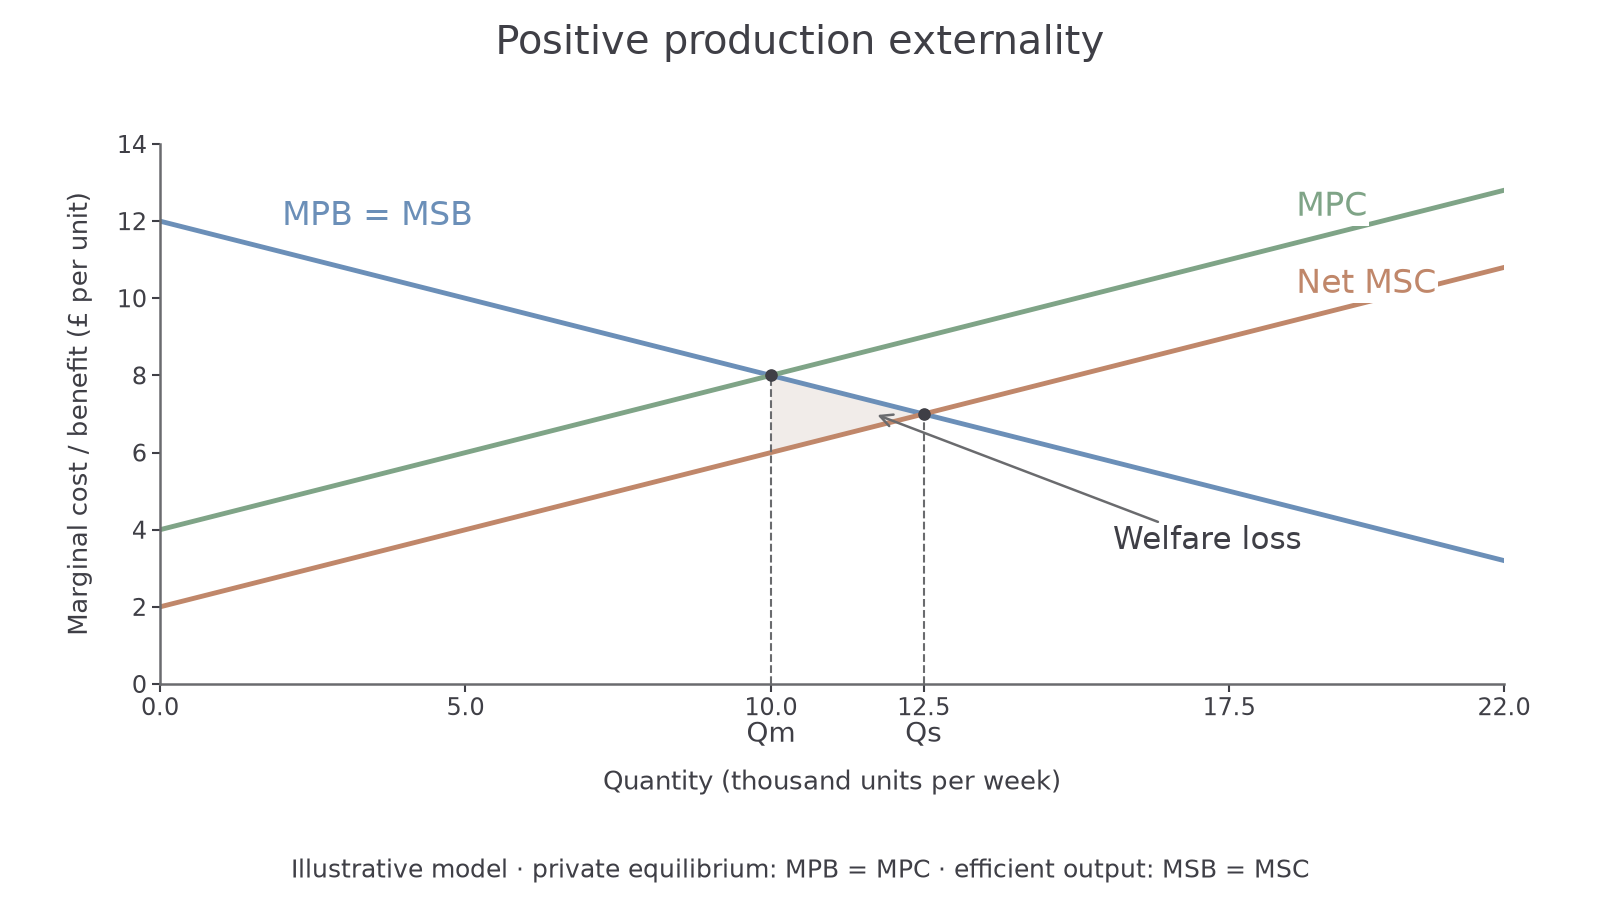
All values are illustrative. A £2 benefit to third parties reduces net social cost per additional unit compared with the producer's private cost.
The private market produces 10 thousand units where MPB equals MPC. At that quantity, MSB is still greater than net MSC, so society would gain from additional output. The efficient quantity is 12.5 thousand. Between these quantities the shaded triangle measures the forgone net social benefit from underproduction.
The external effect determines which account we adjust. Beneficial production can be represented as a reduction in net social cost; beneficial consumption as an addition to social benefit. It is also possible to account for a production spillover in a benefit curve if the whole model is relabelled consistently. What matters is the private decision, the missing third-party effect, and the resulting social optimum. Do not move both cost and benefit curves for one spillover or switch the labels halfway through an explanation.
Compare the four cases by mechanism. Negative production puts MSC above MPC and tends to overproduction. Negative consumption puts net MSB below MPB and tends to overconsumption. Positive production puts net MSC below MPC and tends to underproduction. Positive consumption puts MSB above MPB and tends to underconsumption. In each case the outcome follows from private incentives overlooking a third-party effect, rather than from the activity's name.
Interpreting the welfare model
An externality diagram explains a mechanism only when the relationships represented by its curves are defensible.
The competitive model assumes decision-makers respond to marginal incentives, that other demand and supply conditions are held constant, and that the private market is represented by MPB and MPC. A separate market distortion, such as substantial market power, can change the initial output. We cannot automatically carry a competitive diagram's quantity conclusion into that different starting point.
External costs and benefits can also be hard to value. Noise or illness differs in severity between people; knowledge spillovers may arrive years later; estimates may depend on uncertain effects. A diagram with a constant £2 external effect isolates the logic, but does not claim that real marginal damage is constant. If damage rises sharply with output, the gap between MSC and MPC widens rather than remaining parallel.
Use the welfare area for the question it answers. The gap between private and social curves shows a marginal external effect. The area of that gap over output measures total external cost or benefit under the model. The triangle between MSC and MSB over the quantity difference measures welfare loss relative to the efficient output. Confusing these areas can exaggerate the gain from an intervention.
Efficiency also differs from distribution. Moving output towards may raise total net social benefit while imposing costs on particular producers or buyers. A diagram alone cannot show that everybody gains or that the distribution is fair. The government-intervention lessons examine instruments that change incentives and the conditions under which their benefits exceed their costs.
To analyse a new context, identify the private decision-maker, name the affected third party, state the missing effect, and choose the corresponding curve gap. Then locate the private and social intersections and explain the surplus or forgone gain. A short complete chain can demonstrate understanding; repeating the labels without explaining why quantity differs cannot.
Quick recap
Private incentives omit uncompensated effects on third parties. Compare MPB = MPC with MSB = MSC, then use the relevant cost or benefit gap to explain excessive or insufficient output. The welfare-loss area measures lost net social benefit, while the diagram's assumptions and valuation evidence limit what can be concluded.