1.1 - Circular flow and national income
One person's spending becomes another person's income, but some income leaves the immediate spending stream. Learn how production, incomes and expenditure fit together, why injections and leakages affect activity, and how national accounts avoid counting the same output twice.
Real flows and money flows
The circular flow of income links households supplying productive resources to firms producing goods and services.
In a simple two-sector model, households supply labour, land, capital and enterprise to firms. These are real flows of resources. Firms make goods and services which households consume, another real flow. Money flows travel in the opposite directions: firms pay wages, rent, interest and profit incomes for resources, and households spend income buying output. A worker can therefore be both a resource supplier and a consumer. The model aggregates many different people and businesses; it does not claim that every household works or receives every kind of income.
| Transaction | Real flow | Money flow |
|---|---|---|
| A bakery employs a worker | Labour services: household → firm | Wages: firm → household |
| A household buys bread | Bread: firm → household | Consumption spending: household → firm |
Income is a flow over a period, such as wages of £30,000 per year. Wealth is a stock at a particular date, such as assets less liabilities on 31 December. Spending £1,000 from accumulated savings can exceed this month's income; it does not turn the savings stock into new production. GDP similarly measures output over a stated period, rather than the value of all existing buildings and assets.
In the simplest model, households spend all their income and firms distribute all sales revenue as factor income. It illustrates the connection, but an actual economy also has saving, government, finance and international trade. Those additional channels explain why spending need not immediately return to the firms which generated the initial income.
Injections and leakages
An injection adds spending to the circular flow, while a leakage, also called a withdrawal, removes income from immediate spending on domestic output.
The standard injections are investment I, government purchases G and exports X. Investment here means expenditure on newly produced capital goods or inventories, rather than buying existing shares. Government purchases pay for current goods and services or investment; a benefit is a transfer to a household, not itself new output. Exports bring overseas expenditure into domestic firms' receipts.
The standard leakages are saving S, taxation T and imports M. Saving is income not consumed; banks may channel savings into investment, but S and I are different decisions and need not initially be equal. Taxes reduce income available for private spending; government spending is a separate injection. Imports direct expenditure towards foreign production. If imported goods include domestic retail services, only the imported production is a leakage; the domestic services remain domestic output.
For consistency, a model can define T as net taxes after transfers and define saving on the resulting disposable income. State that convention when using the identity. Do not count a transfer both as government purchases and as the recipient's consumption.
Suppose illustrative annual injections are I = £40 billion, G = £60 billion and X = £50 billion, giving £150 billion. Leakages are S = £35 billion, T = £65 billion and M = £40 billion, giving £140 billion. Planned injections exceed leakages by £10 billion. Firms may experience unexpectedly strong sales and raise production and factor payments; the growing incomes induce further spending and leakages. This is a direction-of-change argument, not a guarantee that real GDP increases by exactly £10 billion.
Flow equilibrium and adjustment
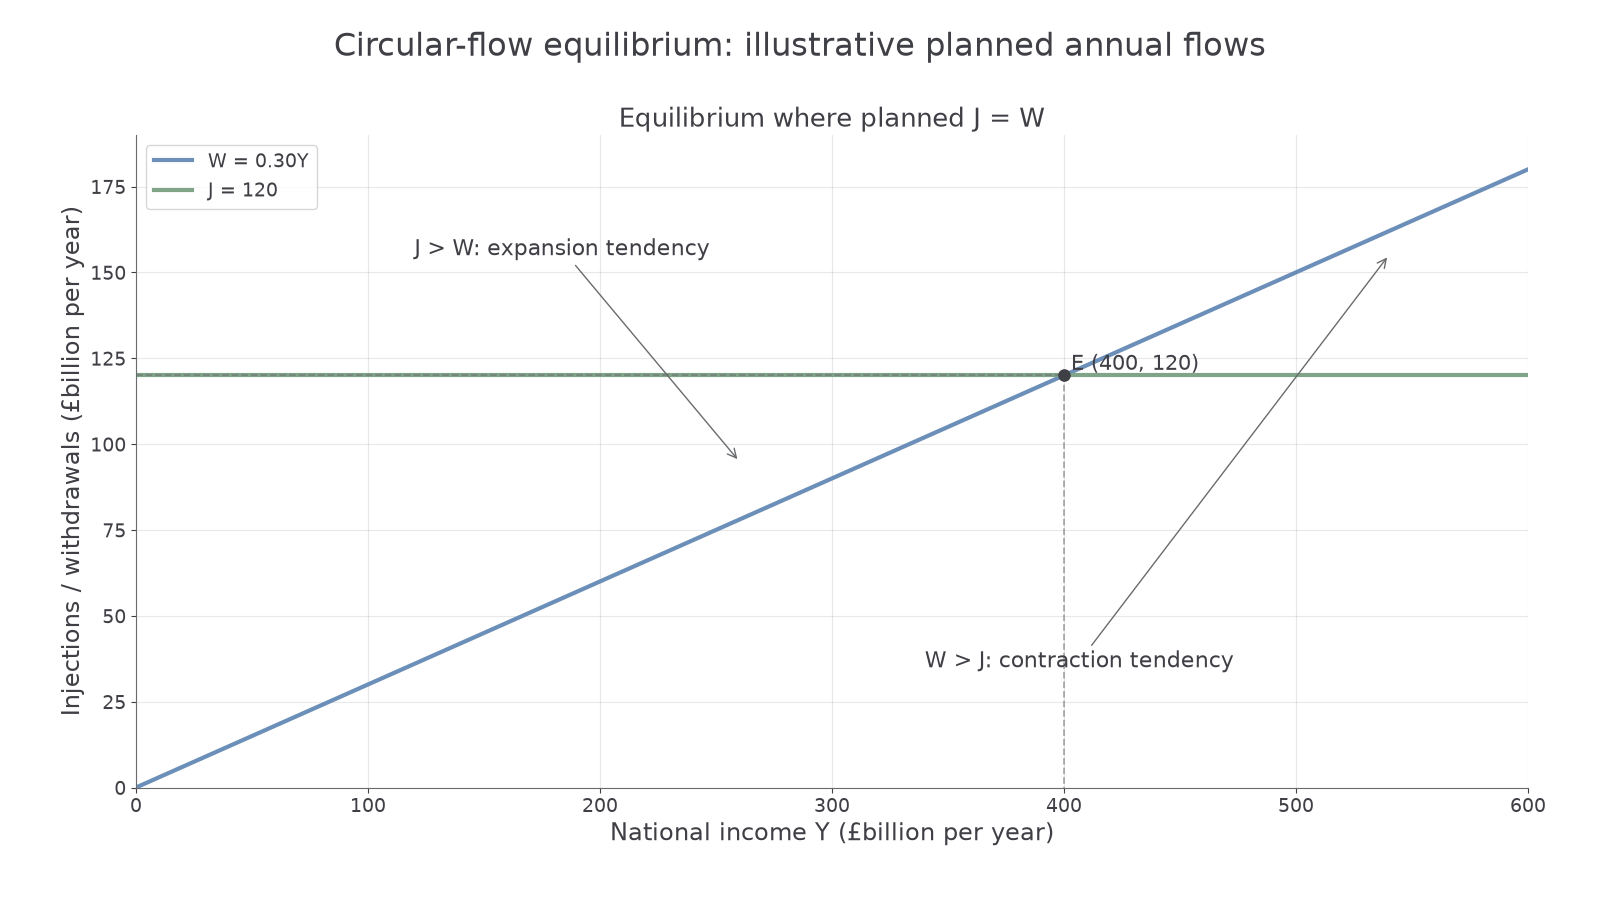
National income is in a spending equilibrium when planned injections equal planned leakages, so firms have no spending-driven incentive to change total production.
Write the condition as , measured in compatible money units over the same period. An illustrative schedule has injections fixed at £120 billion and withdrawals equal to 30% of national income: . Equilibrium is therefore , giving billion. The 0.30 is a fraction of each income level, not £0.30 billion or a 30 percentage-point change.
[DIAGRAM: asset_slug: ocr_h460_flow_equilibrium; caption: Planned injections and withdrawals meet at national income of £400 billion; description: Exact illustrative schedule with annual national income on the horizontal axis, annual injections and withdrawals on the vertical axis, fixed injections120 and withdrawals0.30Y.]
Continue this lesson.
You’re previewing NovaLearn without an account. Create a free account to read the rest.
Create free account