4.4 - Protectionism, tariffs and quotas
Trade barriers change prices, production and the distribution of gains. You will explain protectionism, construct and interpret tariff and quota models, and judge when a case for protection is stronger than a case for free trade.
Forms of protection
Protectionism uses measures that restrict foreign competition or favour domestic producers. A tariff is a tax on imports; an import quota limits the quantity imported. Subsidies can lower domestic producers' costs, while administrative restrictions, local-content requirements and discriminatory standards can make foreign supply more difficult or costly. A genuine health or safety standard is not automatically protectionist: its purpose, evidence and treatment of domestic and imported goods matter.
An ad valorem tariff is a percentage of an import's value. A 10% tariff on a £50 import is £5. With full pass-through and no other change, the price becomes £55, a 10% increase: (55 − 50) / 50 × 100. A specific tariff is a fixed charge per unit, such as £4 per item. A tariff paid at the border can be passed on to buyers, absorbed in exporters' margins or shared, depending on market conditions. The simple model below assumes full pass-through and a small importing country unable to change the world price.
Barriers may aim to protect employment, support infant industries, defend strategic capacity, prevent unfairly subsidised competition or raise revenue. These aims do not prove the measure works or is the cheapest way to achieve the aim. Protection can make imported inputs more expensive for other domestic firms, and other countries may retaliate against exports.
Free trade means trade without discriminatory barriers of this kind. It does not mean abolishing all product standards, environmental rules or taxes. The central comparison is the economic effect of the particular barrier and the available alternative policies.
Tariffs, prices and trade volumes
For a tariff diagram, put price per unit vertically and total domestic-market quantity per period horizontally. Draw upward domestic supply S and downward domestic demand D. A horizontal world-supply line at Pw represents unlimited imports at that price under the small-country assumption. At Pw, read domestic production Qs and domestic consumption Qd; imports are Qd − Qs, not total consumption.
In the illustrative graph, Pw is £10, domestic production is 20 million units and consumption is 80 million. Imports are 60 million. A £4 specific tariff raises the import supply price to £14. Domestic production expands along S to 30 million; consumption contracts along D to 60 million. Imports fall to 30 million. The tariff changes the price facing firms and buyers; it does not shift the domestic demand or supply curves in this static model.
[DIAGRAM: asset_slug: tariff-welfare; caption: A small-country tariff raises price, reduces imports and creates production and consumption welfare losses; description: Domestic supply and demand with world price 10 and tariff-inclusive price 14, output rising from 20 to 30 million, consumption falling from 80 to 60 million, imports falling from 60 to 30 million, and producer gain, government revenue and two deadweight triangles shaded.]
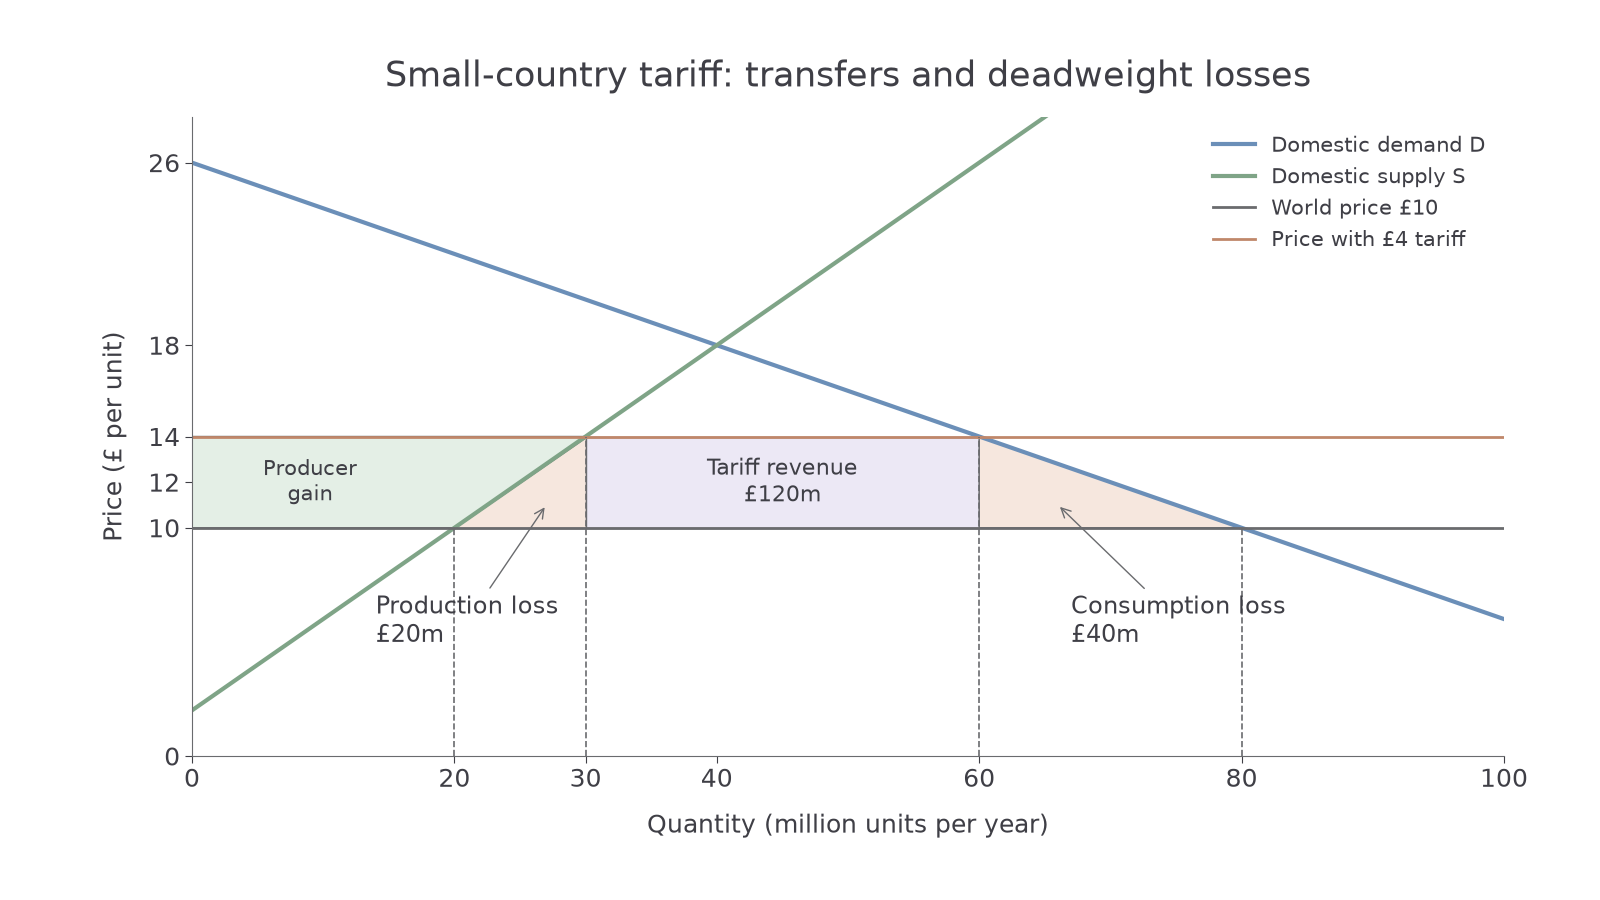
To construct the change, draw Pw + tariff parallel to Pw and mark its intersections with S and D. Project all four quantities to the horizontal axis. Label the remaining import gap at the new price. The height between price lines is the tariff per unit; multiplying it by post-tariff imports gives revenue: £4 × 30 million = £120 million. Multiplying by original imports would overstate revenue because imports have fallen.
Domestic import-competing producers gain sales and a higher price, but buyers pay more and buy less. A firm using the imported product as an input may face higher costs and lose competitiveness. Foreign exporters sell fewer units to this country, assuming they cannot redirect all sales elsewhere.
Tariff transfers and welfare losses
Consumer surplus is the difference between willingness to pay and the price paid; producer surplus is the difference between revenue and variable opportunity costs represented by supply. In the graph, the price rise removes surplus from consumers. Some becomes extra domestic producer surplus and some becomes government revenue. These are transfers within the importing economy, not themselves net national losses under the model's assumptions.
Two areas are deadweight welfare losses. The production triangle occurs because extra domestic units cost more resources than importing them at Pw. The consumption triangle occurs because some units worth more to consumers than Pw are no longer bought. Draw the production triangle between Qs before and after, above Pw and below S; draw the consumption triangle between Qd after and before, above Pw and below D. Their height is the £4 tariff.
The production loss is half × £4 × 10 million = £20 million. The consumption loss is half × £4 × 20 million = £40 million. Total loss is £60 million. In the same graph, consumer surplus falls by £280 million, producer surplus rises by £100 million and government receives £120 million: the net loss is £280 million − £100 million − £120 million = £60 million.
This result assumes no relevant externalities, perfect competition, unchanged world prices and no administrative or retaliation costs. A large country might lower the foreign price by reducing demand, obtaining a terms-of-trade gain, but retaliation and international effects complicate that argument. If extra domestic production causes pollution, its social cost also matters. A diagram's neat areas do not establish the full real-world policy judgement.
Continue this lesson.
You’re previewing NovaLearn without an account. Create a free account to read the rest.
Create free account