4.4 - Oligopoly and strategic rivalry
When a few large firms dominate a market, each must consider how its rivals will respond. This lesson measures concentration and explains strategic interdependence, price rigidity, collusion and non-price competition. It then uses these mechanisms to judge why similar market structures can produce very different outcomes.
Measuring market concentration
An oligopoly is a market in which a small number of firms account for a large proportion of sales.
High entry barriers often protect these firms, but products may be differentiated or fairly homogeneous. The number of suppliers alone does not show the competitive pressure they face: a market can contain many tiny firms and still be dominated by a few large ones. Interdependence, where each firm's decisions affect rivals and their reactions affect it, is central.
An n-firm concentration ratio is the combined market share of the n largest firms. First define the market and measurement, such as annual sales revenue or units. Rank firms by that measure, then add the shares of the largest n. With compatible sales units, a three-firm ratio can also be calculated as .
In an illustrative market with total revenue £200 million, the largest firms earn £70m, £50m and £30m. Their shares are 35%, 25% and 15%, and the three-firm ratio is 75%. They supply three quarters of market revenue, a fraction . It is not the share of the largest firm alone, nor the unweighted average of those three shares.
If the ratio rises from 60% to 75%, the rise is 15 percentage points, or relative to its earlier level. Keep those measures distinct. A merger may change the ranking, so recalculate the top n rather than merely adding a merged firm's shares to the old ratio.
Concentration is an indicator, not proof of collusion or weak competition. Two markets can have the same ratio but different distributions within the leading group. Market definition, imports, substitutes, geographical reach and credible entrants also matter. A high revenue share can partly reflect higher prices rather than more units. Identify what the ratio measures before making a behavioural judgement.
Interdependence and responses
A large firm's pricing decision changes the incentives of its main rivals, so it must anticipate their response.
If one supermarket cuts prices, another may match the cut to retain customers. The first firm's expected increase in market share can then disappear, leaving both with lower margins. If one raises prices, rivals may keep theirs unchanged and attract its customers. Decisions depend on beliefs about rivals, not only the firm's own costs and demand in isolation.
A simple illustrative payoff table makes the tension clear. Entries show A's profit first, then B's, in millions; the figures are invented for the model.
| A's action / B's action | B keeps high price | B cuts price |
|---|---|---|
| A keeps high price | 8, 8 | 3, 10 |
| A cuts price | 10, 3 | 5, 5 |
For A, cutting earns 10 rather than 8 if B keeps the high price, and 5 rather than 3 if B cuts. B faces the same incentives. In this one-period game each has a dominant strategy to cut: it performs better whatever the other does. Both cutting yields 5 each, even though both would earn 8 if both held high prices. The table illustrates a prisoner's dilemma incentive; it does not describe every oligopoly.
Repeated interaction can change incentives because a cut now may trigger retaliation later. Monitoring, trust, demand uncertainty and the number of firms affect the likelihood of sustained cooperation. Firms may also choose quality, capacity or research instead of price. Use the strategic relationship actually supported by the context rather than assuming one payoff pattern fits all markets.
The kinked-demand explanation
The kinked-demand model explains possible price rigidity by assuming rivals respond differently to a price rise and a price cut.
Above the current price, rivals are assumed not to follow a rise, so the firm loses many customers and faces relatively elastic demand. Below it, rivals are assumed to match a cut, limiting customer switching towards the firm: demand is less elastic. The two sections meet at the current price and output, creating a kink.
[DIAGRAM: asset_slug: h460-oligopoly-kink; caption: Different expected rival responses produce a demand kink and a gap in MR; description: Exact piecewise linear AR kink at quantity 6 and price 8 has a flatter upper section and steeper lower section; its MR gap is from 6 to 2, and two MC curves pass through that gap.]
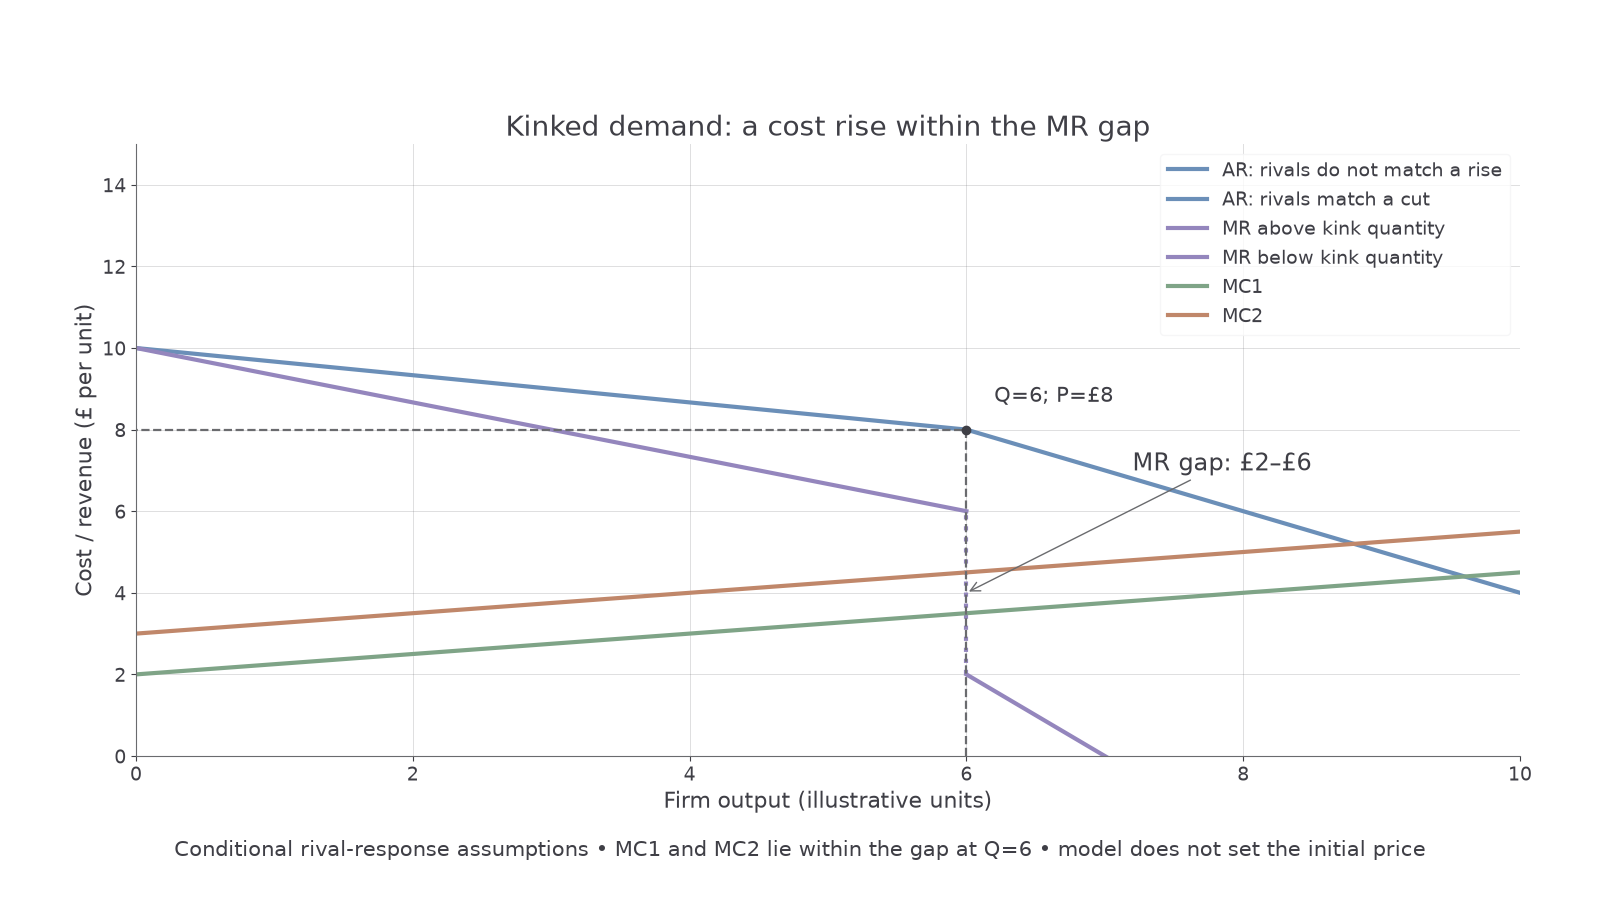
The figure uses AR for quantities below Q=6 (prices above £8), and for quantities above Q=6 (prices below £8). The sections meet at Q=6 and P=£8. Their corresponding MR curves are and . Immediately to the left of Q=6, MR approaches £6; immediately to the right it approaches £2. This discontinuity follows from the change in the slope of TR at the kink.
Continue this lesson.
You’re previewing NovaLearn without an account. Create a free account to read the rest.
Create free account