2.8 - The Phillips curve and policy expectations
Lower unemployment and higher inflation sometimes occur together, but the relationship is not a permanent policy menu. Learn how capacity, expectations and supply shocks change the Phillips curve, and why policymakers must combine the model with evidence.
The natural rate and NAIRU
The natural rate of unemployment is the rate consistent with the economy's underlying labour-market structure and equilibrium rather than temporary demand deficiency.
It includes frictional search and structural mismatches; it is not zero unemployment or an unchangeable biological rate. Skills, mobility, matching, institutions and participation can change it. A worker unable to fill a specialist vacancy can remain unemployed even when total demand is sufficient. Improved training and matching can reduce persistent unemployment without relying solely on extra spending.
The non-accelerating inflation rate of unemployment (NAIRU) is the unemployment rate consistent with inflation not accelerating, given the model and other influences. In an expectations-augmented account, unemployment below this rate puts upward pressure on inflation as wages and price expectations adjust; above it tends to weaken inflation pressure. The natural rate and NAIRU are closely related in many simplified models, but NAIRU is specifically defined through inflation dynamics. Neither is observed directly, and estimates vary with methods and time.
“Non-accelerating” does not mean zero inflation or inflation at a government's target. An economy can have stable 5% inflation at its NAIRU; it has no acceleration but still misses a 2% target. Supply shocks or changing expectations can complicate any estimated relationship. A low unemployment rate alone therefore does not prove that inflation must accelerate next month.
Capacity in Keynesian and neo-classical models
Different aggregate-supply models explain why stronger demand can create employment with little inflation in one situation and mainly higher prices in another.
In a Keynesian aggregate-supply model, considerable unused capacity permits extra real output with limited price pressure: the flatter range of AS. As bottlenecks appear, costs and prices rise alongside output. At the vertical full-capacity range, greater AD cannot sustainably raise output further. Some spare machinery can coexist with shortages of particular skilled workers, so capacity constraints can emerge before every resource is employed.
In a neo-classical long-run model, LRAS is vertical at potential real output. After wages, expectations and other prices adjust, demand does not permanently increase productive capacity. Short-run output can rise when wages or perceptions have not yet adjusted; that is represented by upward-sloping SRAS. Changes in resources, productivity and institutions shift potential output, so vertical LRAS does not mean real output can never grow.
[DIAGRAM: asset_slug: ocr_h460_as_models; caption: Keynesian capacity ranges and neo-classical long-run capacity; description: Two-panel illustrative AS model, with a flat-rising-vertical Keynesian curve on the left and vertical neo-classical LRAS with SRAS and AD on the right.]
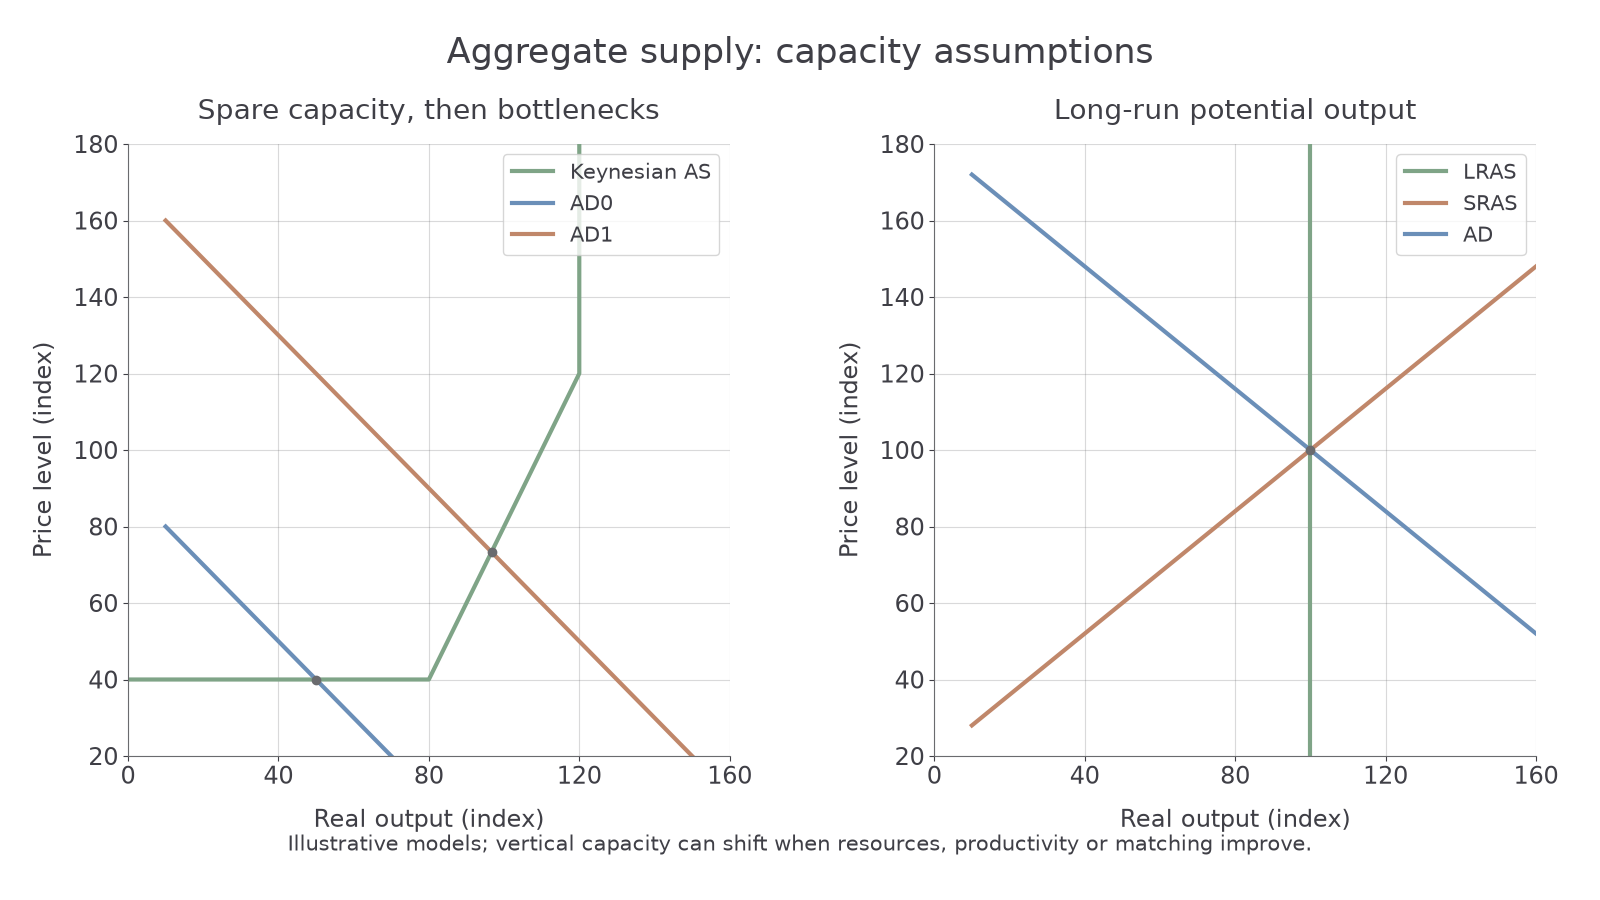
To construct each diagram, label price level vertically and real output horizontally. Draw the Keynesian curve flat when resources are underused, rising through bottlenecks and vertical at capacity; draw neo-classical LRAS vertically at labelled potential output. Add downward AD to show the relevant equilibrium, and distinguish a movement of demand from a capacity shift. The vertical axis is the price level, whereas a Phillips curve uses the rate of inflation. A higher price-level equilibrium over an adjustment interval can be associated with inflation, but the two vertical variables are not interchangeable.
The models guide conditional reasoning. Stronger demand is more likely to reduce unemployment with little inflation when matching capacity is available. Near capacity, the same demand increase creates greater price pressure. Long-run gains in employment and output are more sustainable if productive capacity expands.
The short-run Phillips curve
The short-run Phillips curve (SRPC) models an inverse relationship between unemployment and inflation for a given expected inflation rate and supply conditions.
Higher AD can raise output and employment while bidding up wages and prices, so unemployment falls as inflation rises. Lower AD can weaken price pressure but increase unemployment. Firms recruit more when sales rise, while tighter labour markets strengthen wage bargaining; with expectations temporarily fixed, firms can expand employment before all nominal costs fully adjust. This explains a possible short-run movement, not a rule that unemployment mechanically causes a precise inflation rate.
Put unemployment rate (%) on the horizontal axis and inflation rate (%) on the vertical axis. Draw a downward-sloping SRPC and label its expectations assumption. On an illustrative curve, A is 6% unemployment and 2% inflation; B is 4% unemployment and 4% inflation. A to B is a movement along that curve caused by a demand expansion while expectations and supply conditions remain fixed.
Continue this lesson.
You’re previewing NovaLearn without an account. Create a free account to read the rest.
Create free account