H460/03 - Climate, resources and economic policy
Climate policy changes incentives in individual markets and affects spending, investment and living standards across the economy. Connect externalities and intervention from H460/01 2.8 and 2.11 with development, fiscal policy and productive capacity from H460/02 2.2, 3.1 and 3.3. The purpose is to explain the links and judge their strength in an unfamiliar case.
Carbon costs and welfare
A private transaction can impose climate damage on people who neither buy nor sell the product. This external cost makes marginal social cost, MSC, greater than marginal private cost, MPC. If buyers' marginal benefit reflects all benefits, MPB equals MSB. A competitive market then produces where MPB equals MPC, although the efficient quantity occurs where MSB equals MSC. Between these quantities, the cost to society of another unit exceeds its benefit.
Use a deliberately simplified carbon-intensive product market. Each unit creates one tonne of emissions; the external damage is assumed constant at £20 per unit. At eight million units, private cost and benefit are £60, but social cost is £80. At six million units, social cost and benefit are £70. Cutting these last two million units sacrifices some private benefit but avoids greater social cost: the net welfare gain is the shaded triangle, £20 million in this numerical model.
[DIAGRAM: asset_slug: themes-climate-carbon-welfare; caption: Private and social equilibria in an illustrative carbon-intensive market; description: Exact plotted MPC, MSC and MSB curves with private quantity eight million, efficient quantity six million and the welfare-loss triangle.]
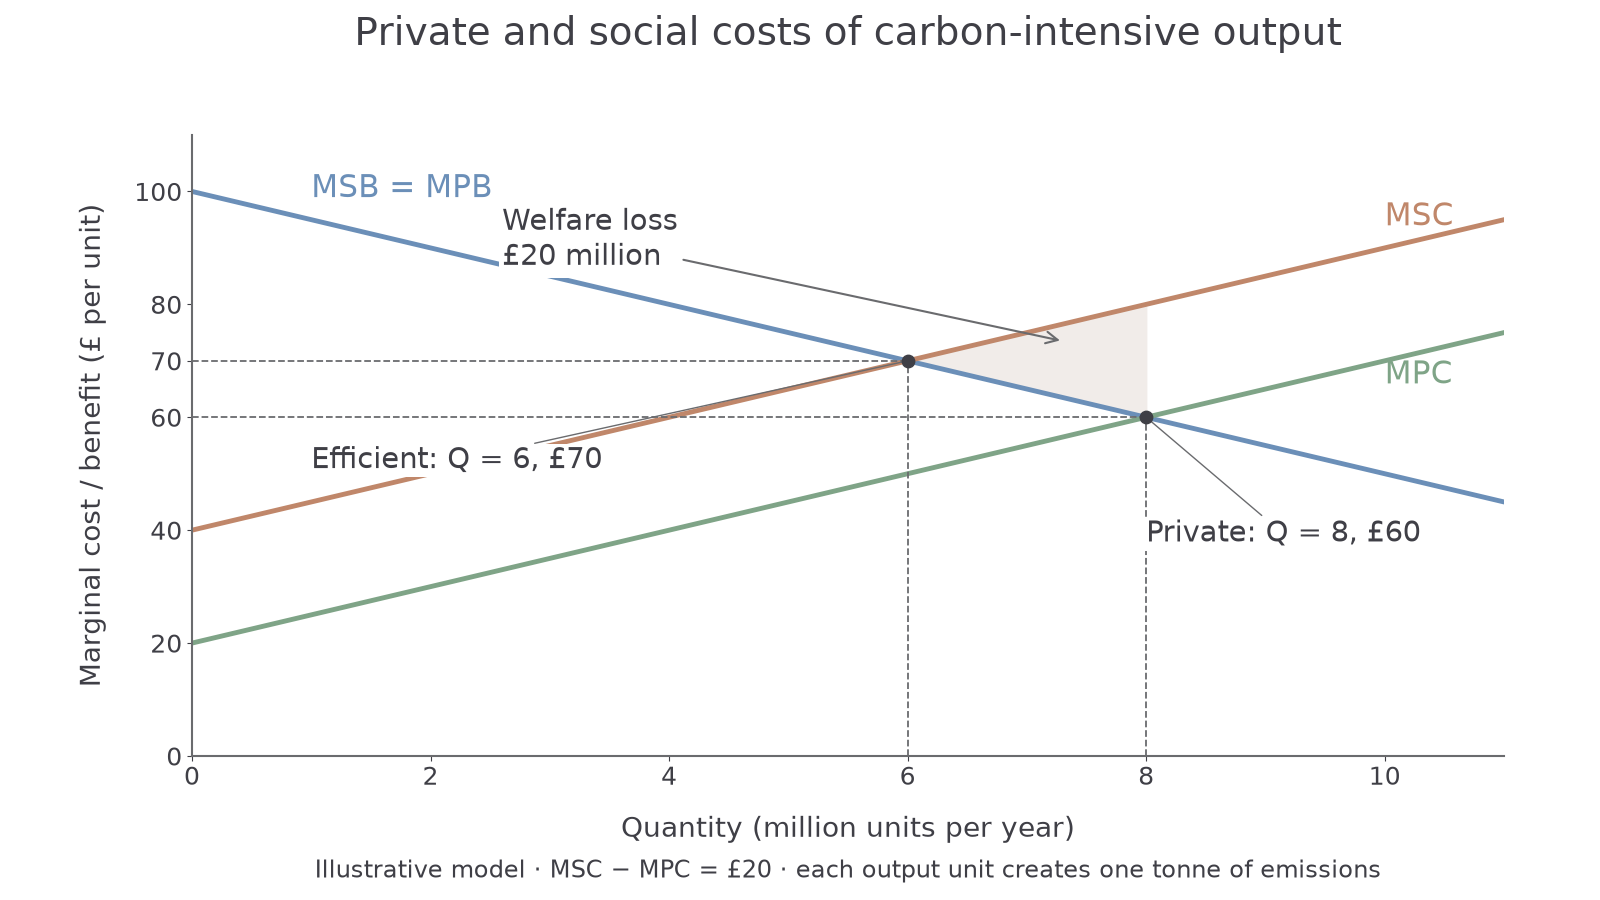
To construct this model, label the horizontal axis quantity of the product per year and the vertical axis marginal costs and benefits in £ per unit. Draw MSC above MPC by the assumed marginal external cost; draw MSB downward. Mark both intersections and the area between MSC and MSB over the excess output. The diagram does not measure actual climate damage: choosing the damage estimate is itself an evidence problem.
Pricing and other instruments
A carbon price makes emitting more costly and makes lower-emission substitutes relatively attractive. In the model, a £20 tax per unit moves the effective private cost curve onto MSC. Quantity falls to six million units, buyers pay £70 and sellers retain £50 after tax. Revenue is the tax multiplied by the post-tax quantity: £20 × six million = £120 million. Tax payments are a transfer to government, not an additional external damage or a welfare loss by themselves.
That efficient result needs strong assumptions: the tax matches marginal damage, emissions are measurable, evasion is limited and the model includes all relevant benefits and costs. An actual tax can improve allocation without meeting every condition. If cleaner substitutes are unavailable, demand may respond little initially: higher prices then impose a large burden while emissions fall only slightly. Investment and substitution can increase responsiveness later.
Tradable pollution permits set a total emissions cap and let firms trade permission to emit. Firms with low abatement costs reduce emissions and sell permits to firms with higher costs, helping meet the cap at lower total cost. A tax makes the rate more predictable but leaves emissions uncertain; a binding cap makes covered emissions more predictable but leaves the permit price uncertain. Monitoring matters under either instrument.
Regulation can prohibit a particularly damaging activity or set efficiency standards, but uniform rules may ignore different firms' costs. Subsidies for clean technology reduce its private cost and can accelerate adoption where learning benefits spill over. They cost public funds and may subsidise purchases that would happen anyway. A useful judgement identifies the obstacle: a price incentive suits unpriced damage; a standard may suit difficult monitoring or harmful behaviour that must stop; infrastructure may be necessary before either works well.
Distribution and revenue recycling
The same extra energy payment can take a larger share of a poorer household's income. Calculate that share by dividing the extra annual payment by annual income and multiplying by 100. Suppose an illustrative policy adds £180 to the annual costs of two households. For income of £18,000, £180 ÷ £18,000 × 100 = 1%; for £60,000, the share is 0.3%. The burden is regressive relative to income in this comparison. Income alone is incomplete evidence: a rural household may need more fuel, while a well-insulated urban home may need less.
Revenue recycling uses policy receipts for transfers, tax reductions or public services. A £220 fixed transfer to the poorer household more than offsets its £180 extra payment, leaving it £40 better off before any other effects. It can still face an incentive to conserve energy: using an additional unit remains costly because the transfer does not increase with energy use. Reimbursing each extra unit would weaken that incentive.
Targeted support limits fiscal cost but requires reliable eligibility information and may miss vulnerable households. Universal transfers reach more people but spend revenue on households that do not need compensation. Firms' adjustment costs and workers' job losses may require training or regional investment, rather than merely a household payment. The IMF's climate fiscal analysis supports combining carbon pricing with protection for vulnerable households, workers and communities; it does not guarantee that every proposed compensation scheme succeeds.
Continue this lesson.
You’re previewing NovaLearn without an account. Create a free account to read the rest.
Create free account