2.11 - Taxes, subsidies and price controls
Governments can change market incentives or constrain the price at which trades occur. This part of 2.11 explains taxes, subsidies and price controls, including who bears their effects and the conditions that determine their success. Other 2.11 lessons cover the remaining intervention instruments and government failure more broadly.
Tax wedges and incidence
An indirect tax on a product creates a gap between the price the buyer pays and the amount the seller keeps.
A specific tax is a fixed amount per unit sold, such as 20p per item. For a competitive market represented by supply and demand, a tax collected from sellers raises the effective supply curve vertically by that amount: at every quantity, sellers require the original price plus the tax to cover the same private costs. An ad valorem tax is a percentage of value. Its per-unit amount changes with the price, so its supply shift need not be parallel. Do not use the fixed vertical-distance rule for every kind of tax.
[DIAGRAM: asset_slug: h460-specific-tax; caption: A specific tax raises the buyer price and lowers the seller's net receipt, with a constant vertical tax wedge; description: Exact illustrative demand12 minus0.4Q, original supply2 plus0.4Q, taxed supply4 plus0.4Q, original Q12.5 P7, taxed Q10 consumer price8 and producer receipt6, in thousands of units weekly and pounds per unit.]
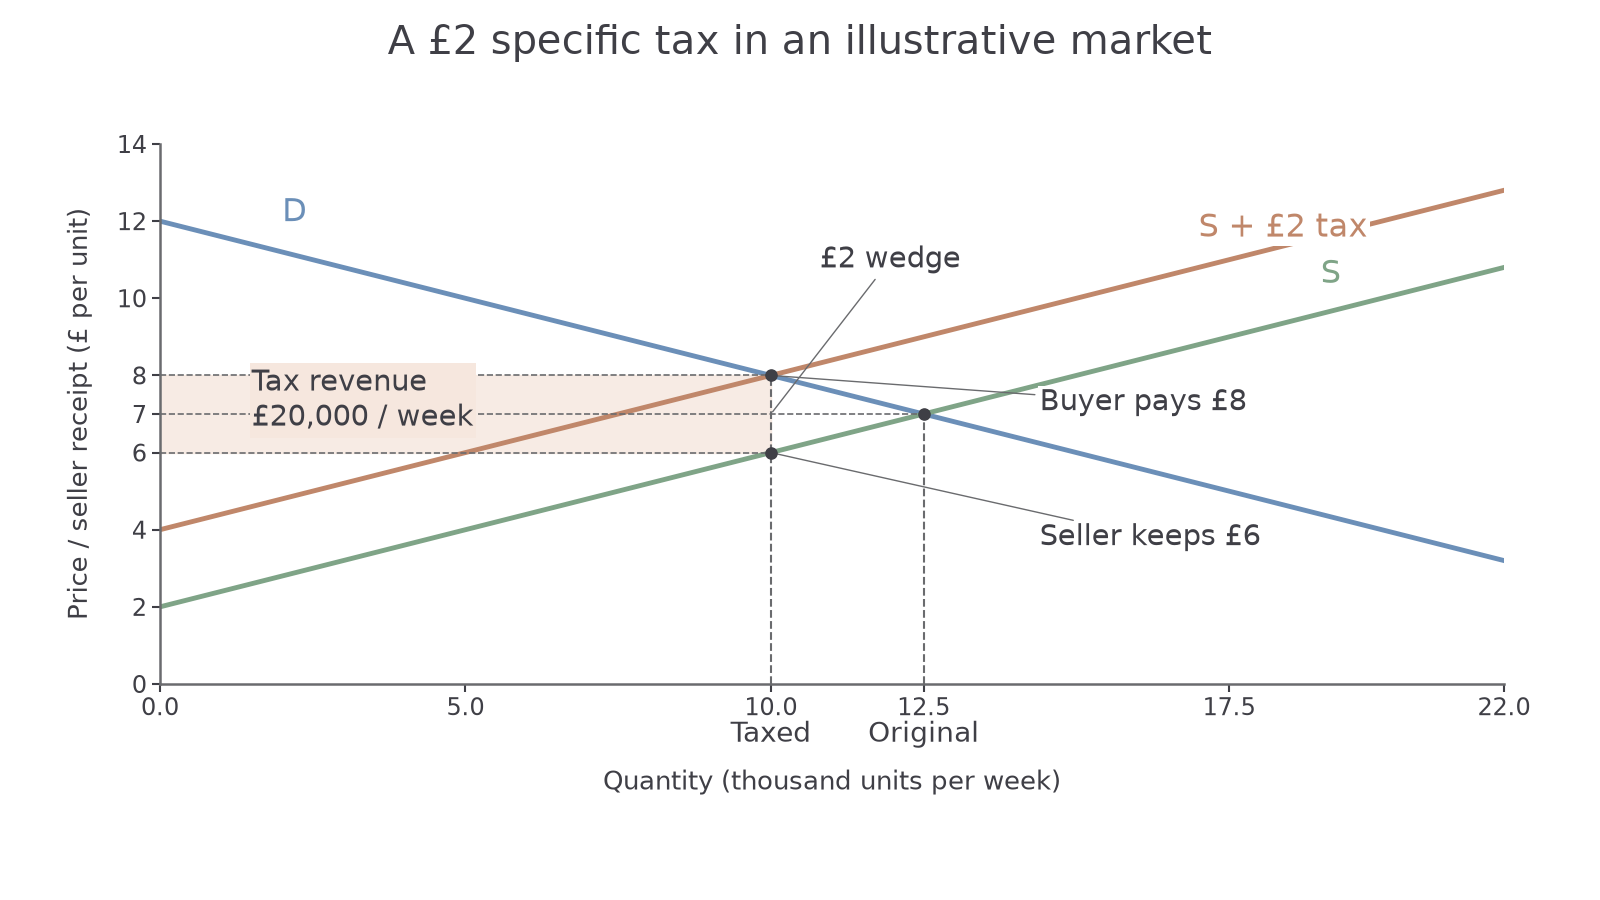
The illustrative tax is £2 per unit. Quantity is thousands of units per week. The buyer's price and the seller's net receipt are different after the tax.
Initially the equilibrium is 12.5 thousand units at £7. With the tax, demand intersects the taxed supply curve at 10 thousand units and the buyer pays £8. At that same quantity the seller receives £6 after paying the £2 tax. The price consumers pay rises by £1; the seller's net receipt falls by £1. The buyer–seller wedge, £8 − £6, equals the tax, even though the buyer's price did not rise by the full tax.
Tax incidence is the distribution of the tax burden. Consumers bear the increase in the price they pay; producers bear the reduction in their net receipt, relative to the no-tax equilibrium. The person legally required to send the tax payment is not necessarily the person who bears all of its economic burden.
In this example each side bears £1 of the £2 wedge, a share of . For another dataset, calculate each price change relative to the original equilibrium, then divide it by the tax per unit to obtain that side's share. Do not divide by the buyer's whole price, which includes the payment for the product itself.
The less responsive side of the market tends to bear more. If buyers have few alternatives and demand is inelastic relative to supply, they reduce purchases little when price rises, allowing more of the tax to pass into the buyer price. If demand is elastic relative to supply, attempts to raise the buyer price lose many customers, so producers absorb more through a lower net receipt. Supply responsiveness matters too: producers who can readily switch production resist reductions in their net price more successfully than those with few alternatives. The formal calculation of price elasticity of supply belongs in the other 2.6 lesson.
To construct the graph on paper, label price and quantity, draw original supply and demand, then shift supply upwards by the specific tax. Mark the new quantity, read the buyer price at taxed supply, and read the seller receipt at original supply at the same quantity. Notebook practice (ungraded): reconstruct the stated graph and mark both prices and the wedge. A typed account of incidence does not demonstrate a drawn diagram.
Tax revenue and welfare
Tax revenue is the tax collected on each unit multiplied by the number of units actually sold after the tax.
In the preceding model, the government receives per week. Use the post-tax quantity, not the original 12,500 units, because the unsold units generate no tax payment. The tax rectangle has the tax wedge as its height and post-tax quantity as its width.
Revenue and consumer expenditure are different. Consumers spend . Sellers keep before their other costs. The £20,000 difference is the government's revenue. All three use the same actual sales quantity.
An undistorted starting market
Suppose the original supply and demand curves already represent social cost and social benefit: there is no externality in this starting case. The tax reduces output below the efficient 12,500 units. Between 10,000 and 12,500, the benefit of a trade would exceed its resource cost, but the tax prevents it. Lost gains from trade form a welfare-loss triangle between original demand and supply over that interval. Its area here is per week.
The tax payment itself is not all deadweight loss: it transfers money to government. The lost mutually beneficial trades are the allocative loss in this simplified model. Collection costs or the benefits of spending the revenue require further analysis; they are not automatically inside that triangle.
A market with an external cost
The purpose and initial distortion change the judgement. If producing each unit imposes an external cost of £2, the original private supply is below social cost. A £2 tax can make producers face that missing marginal cost. The same supply shift now moves output from excessive production towards MSB = MSC and reduces the externality welfare loss taught in 2.8. A tax can therefore improve allocation rather than always creating a new loss.
That conclusion depends on the tax matching the relevant external cost and on actual behaviour. If marginal damage differs between locations or rises with output, one flat tax may be a poor fit. If buyers respond very little, quantity and damage may fall little, although revenue is raised. A tax intended to reduce harm and a tax intended to raise revenue can face different trade-offs. Judge the objective, the starting market and the response together.
Subsidy incentives and cost
A subsidy reduces the private cost of producing or buying a product and can increase its quantity traded.
A subsidy is a government payment that supports an activity. In the simple model below it is a fixed payment to sellers for every unit sold. Sellers can accept a lower buyer price because they also receive the subsidy. The effective supply curve therefore shifts vertically downwards by the payment per unit.
[DIAGRAM: asset_slug: h460-unit-subsidy; caption: A per-unit subsidy lowers the buyer price, raises the seller's total receipt and increases output; description: Exact illustrative demand12 minus0.4Q, original supply2 plus0.4Q, subsidised supply0.4Q, original Q12.5 P7, subsidised Q15 buyer price6 and seller receipt8, in thousands of units weekly and pounds per unit.]
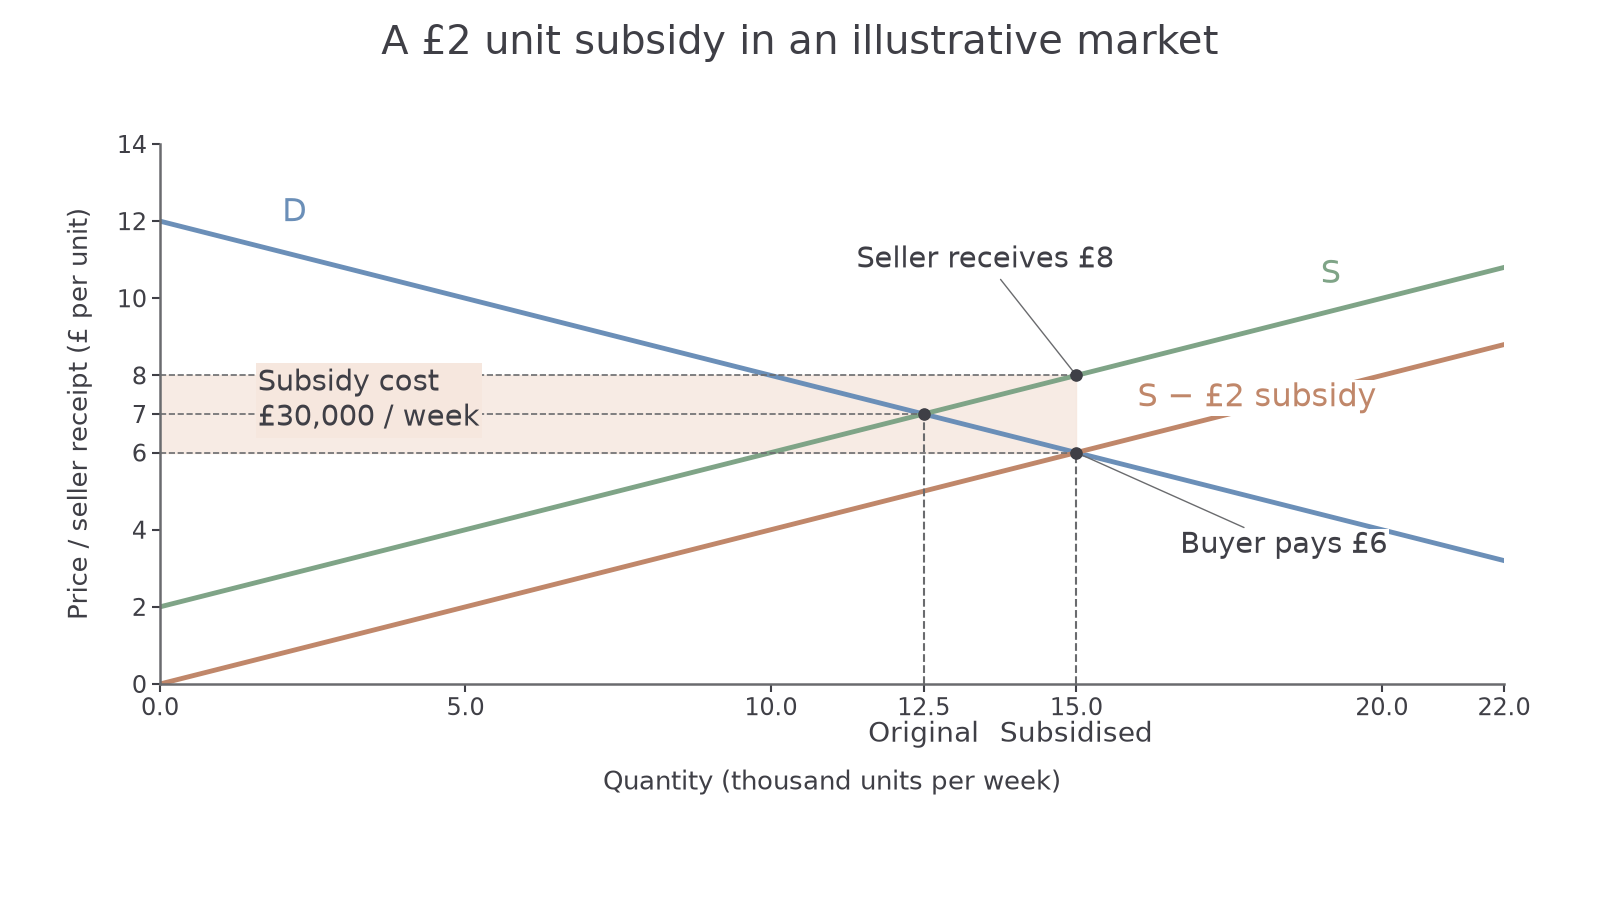
The illustrative subsidy is £2 per unit. The seller's total receipt equals the buyer price plus the government payment.
The original market trades 12.5 thousand units at £7. After the subsidy, output rises to 15 thousand and the buyer pays £6. Sellers receive £8 per unit in total: £6 from the buyer plus £2 from government. Buyers gain through a lower price while sellers gain through a higher receipt. The share of the benefit again depends on relative demand and supply responsiveness; a subsidy need not reduce the buyer price by its full value.
Government spending is per week. This is a fiscal cost, not evidence that the subsidy has no benefit. Its opportunity cost is what those public resources could have achieved elsewhere, or the consequences of financing the expenditure.
A subsidy can improve allocation when the activity creates an external benefit that the private decision overlooks. For example, support for training can increase provision and generate skill benefits for other employers. A subsidy set to the relevant marginal external benefit can move output towards the social optimum. For a positive consumption externality, a consumer subsidy or a seller subsidy that lowers the buyer price can encourage purchases; show which private incentive the chosen instrument changes.
By contrast, with no external benefit or other relevant distortion, pushing output beyond the original social optimum causes extra units whose resource cost exceeds their benefit. An excessive subsidy can also overshoot the optimum in an externality market. “More output” is therefore not enough to establish success.
The effect depends on capacity, take-up and targeting. If training places are limited in the short run, a payment may raise providers' receipts more than provision. If support reaches activities that would have happened anyway, part of the spending adds little output. If the external benefit is concentrated in particular activities, a broad subsidy may spend heavily on low-benefit units. A judgement should compare the additional social gains with the public-resource cost under the stated conditions.
Maximum prices and shortages
A maximum price constrains what sellers may charge, rather than directly paying or taxing each transaction.
A maximum price, or price ceiling, is a legal upper limit. It is binding only when set below the price that would otherwise clear the market. A ceiling above equilibrium does not restrict the current market price.
[DIAGRAM: asset_slug: h460-price-controls; caption: A binding maximum price creates excess demand while a binding minimum price creates excess supply; description: Two exact illustrative supply-demand panels using D12 minus0.4Q and S2 plus0.4Q, equilibrium Q12.5 P7, maximum P6 with Qs10 Qd15, and minimum P8 with Qd10 Qs15.]
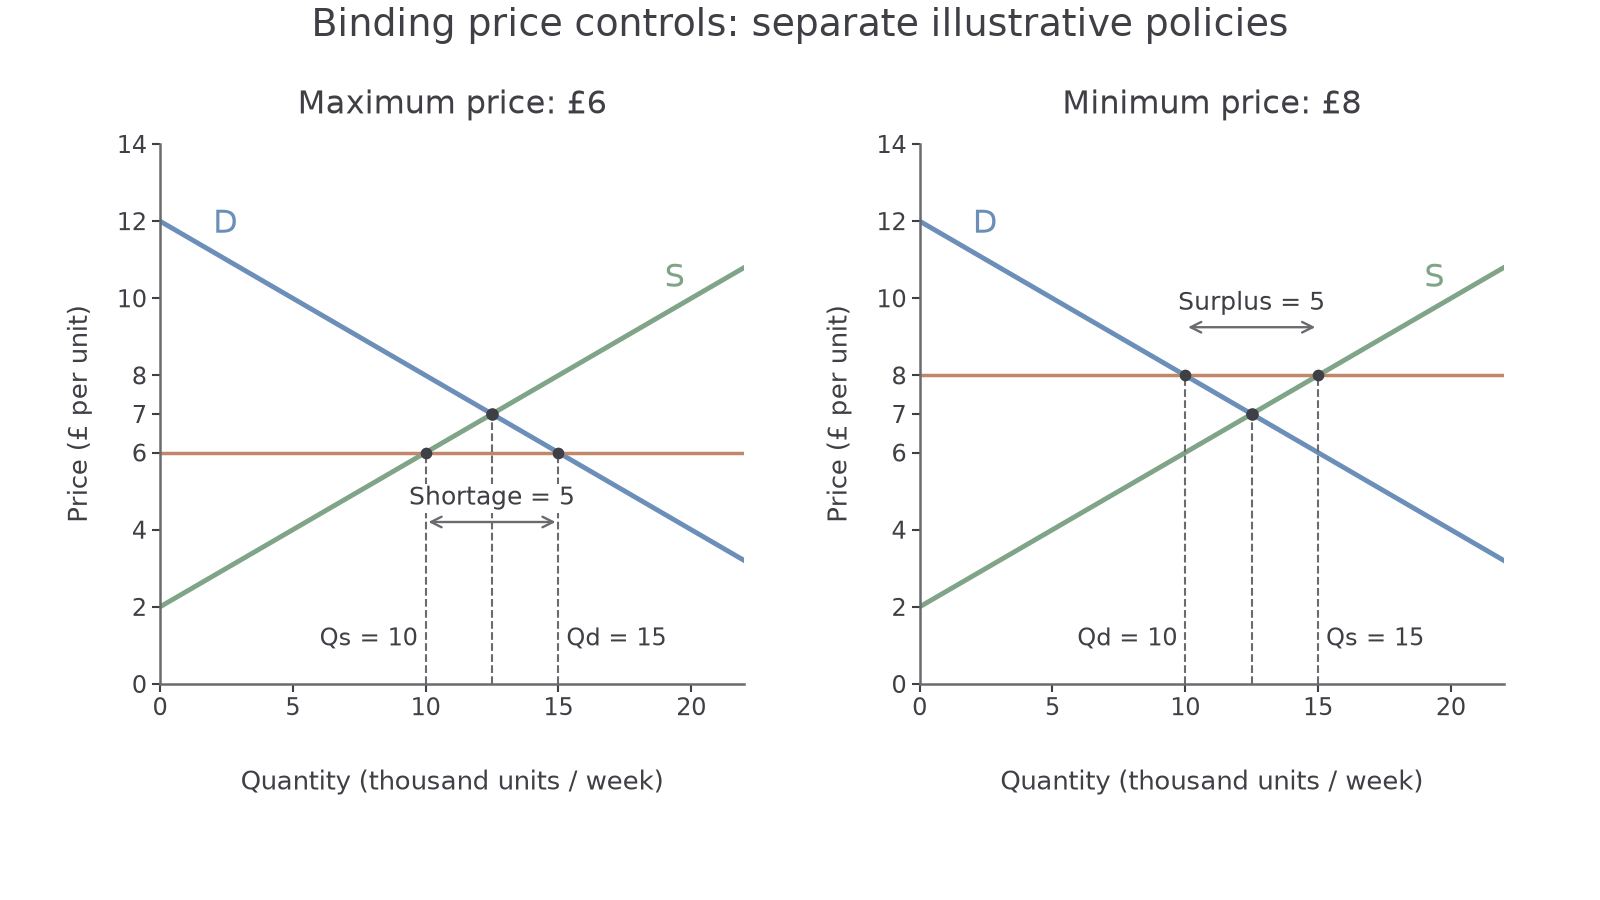
The two panels show separate illustrative policies in the same underlying market. Quantity is thousands of units per week and price is pounds per unit.
At the £6 ceiling in the left panel, consumers demand 15 thousand units but producers supply only 10 thousand. Excess demand, or a shortage, is 5 thousand units. The ordinary price rise that would remove the shortage is prohibited. Quantity demanded is not the number actually purchased: under these assumptions, at most the 10 thousand supplied units can be traded.
A ceiling may make an essential good more affordable for buyers who obtain it, but availability must be considered. Some consumers may face queues, waiting lists, search costs or rationing. Sellers may reduce quality or investment if the controlled receipt weakens their incentive to supply. Informal payments can arise if enforcement is weak. These are possible behavioural responses, not automatic outcomes in every market.
For example, a rent ceiling below the market-clearing rent can lower payments for covered tenants while increasing demand for covered housing and discouraging supply over time. The response depends on exemptions, duration, the ability to build or withdraw units and complementary provision. A government that supplies additional housing or uses a transparent allocation system can change the outcome compared with a ceiling alone.
Analyse price and access separately. The policy can achieve a lower legal price and still leave some intended beneficiaries unable to obtain the good. Its distributional effect depends on who gets the limited supply, not only the price printed on the graph. Long-run supply adjustments can make the shortage different from its initial size.
Minimum prices and surpluses
A minimum price prevents the market price from falling below a stated legal lower limit.
A minimum price, or price floor, is binding when above the price that would otherwise clear the market. A floor below equilibrium does not force the price to rise from its existing level.
[DIAGRAM: asset_slug: h460-price-controls; caption: In the right panel a binding minimum price puts quantity supplied above quantity demanded and creates a surplus; description: The same exact illustrative price-control graph, repeated here so the minimum-price teaching part contains the floor, its quantities and its surplus.]
The right panel shows the separate illustrative £8 floor. It does not include government purchases of the surplus.
In the right panel of the price-control graph, a floor of £8 encourages supply of 15 thousand units but reduces quantity demanded to 10 thousand. Excess supply, or a surplus, is 5 thousand units. Without government purchases or another buyer, these extra units remain unsold; it is wrong to calculate private sellers' revenue as £8 multiplied by all 15 thousand units merely offered for sale.
A floor can support the receipt per unit sold, for example in an agricultural market, but revenue depends on the units sold. Higher prices can reduce consumers' purchases and make the good less affordable. If government guarantees to buy the surplus, purchases, storage and possible disposal create additional public costs. A price floor alone is different from that guarantee: specify the policy rather than assuming government buys every unsold unit.
A minimum price can also aim to reduce harmful consumption. If the relevant demand is responsive, a higher binding price can reduce purchases; if demand is strongly inelastic, the quantity reduction may be small and spending can rise. The price rise goes to sellers unless another policy, such as a tax, redirects it. A minimum price and an indirect tax are therefore not financially interchangeable even if both reduce consumption.
Judging a control
Start with the uncontrolled equilibrium and the control's position. Explain the resulting quantities demanded and supplied, identify the shortage or surplus, then trace the consequences for the policy's objective and affected groups. A ceiling's affordability aim or a floor's producer-support aim cannot be judged by price alone.
Elasticities, enforcement, time and complementary measures matter because they alter these links. State how: more responsive supply may make a ceiling's long-run shortage larger; government buying can remove a floor's unsold surplus but add fiscal cost. Do not turn these conditions into a generic list detached from the market. Other 2.11 lessons compare further instruments and develop causes and consequences of government failure.
Quick recap
Taxes and subsidies create wedges between buyer payments and seller receipts, with burdens or benefits shaped by responsiveness. Tax revenue and subsidy cost use the quantity actually traded. Binding price controls create shortages or surpluses, so judge access, sales, welfare and the policy's objective as well as the legal price.