2.4 - Inflation, price indices and real values
A falling inflation rate can leave prices much higher than before. Learn to separate rates from levels, calculate price and real-value changes, and explain why demand-driven and cost-driven inflation have different consequences.
Price levels and inflation rates
Inflation is a sustained increase in the general price level, rather than a rise in the price of just one product.
Disinflation means a falling rate of inflation: prices still rise if the rate remains positive. Deflation means a sustained fall in the general price level, so the inflation rate is negative. Hyperinflation is exceptionally rapid inflation that seriously disrupts money's roles and economic decisions; it is not a synonym for any rate above target.
An illustrative price index rises from 100 to 110, then 115.5, then falls to 113.19. Inflation is first 10%, then 5%, then −2%. The second interval is disinflation despite a rising price level; the third is deflation. The final price level is still 13.19% above the starting level. A negative rate this year need not reverse all earlier inflation.
[DIAGRAM: asset_slug: ocr_h460_inflation_levels; caption: Disinflation raises the price level more slowly, while deflation lowers it; description: Two panels showing an illustrative price index of 100, 110, 115.5 and 113.19, and interval inflation rates of 10, 5 and minus 2 percent.]
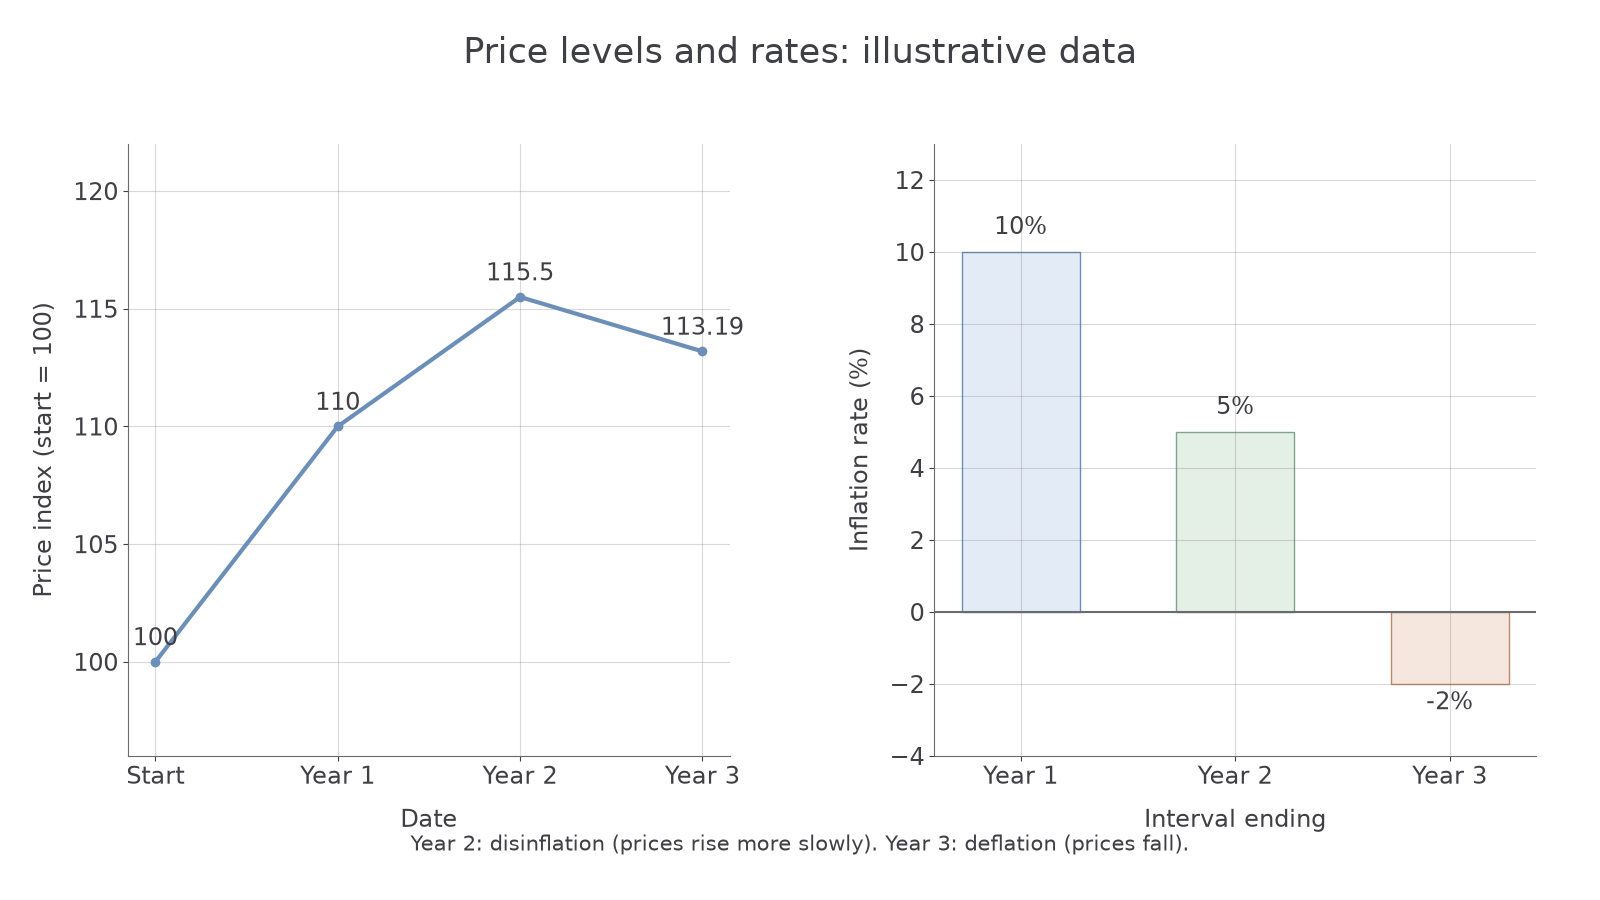
An annual rate compares a month with the same month a year earlier; a monthly rate compares consecutive months. A falling annual rate can reflect a large previous increase leaving the comparison, called a base effect, as well as changed current prices. Always name the interval. A fall from 10% to 5% is five percentage points, or a 50% decrease in the inflation rate; it is not a 5% fall in prices.
What CPI and RPI measure
A price index measures price change relative to a stated base, using a representative basket and weights for spending on different items.
If food accounts for a greater share of expenditure than postage, the food category receives a greater weight. Statistical offices collect comparable prices, allow for quality changes and update basket coverage and weights. An index of 120 with base 100 means the measured price level is 20% above the base, not that annual inflation is 20%. The base is a reference; rebasing alone changes index values without changing the underlying price changes.
For a simple illustrative fixed basket, food has weight 0.4 and services 0.6. Their price relatives are 110 and 105. The weighted index is : basket prices are 7% above the base. This is a teaching example, not the full chained official methodology.
The UK Consumer Prices Index (CPI) measures consumer price changes and is the measure used for the inflation target. Retail Prices Index (RPI) differs in population coverage, housing coverage and calculation. RPI includes items such as mortgage interest payments and Council Tax that CPI excludes; CPI also has other coverage and weight differences. At many basic aggregation stages CPI uses a geometric mean while RPI uses arithmetic formulae, though neither index uses only one formula for every item. CPIH adds owner-occupier housing costs using rental equivalence and Council Tax to CPI; it is distinct from RPI's housing treatment. RPI is a legacy measure and is not an Accredited Official Statistic. These distinctions follow ONS guidance, revised March 2026.
No national average captures every household's experience. A renter buying much food can face a different effective price change from a mortgage-free owner spending more on services. Quality adjustment, new products, expenditure weights and substitution also matter. A rise in one household's total bill caused by buying more units is not itself higher unit prices in CPI.
Calculating inflation from an index
Inflation over a period is the percentage increase in the price index over that period, using the initial index as the denominator.
Inflation between two dates
If an illustrative index is 125 in year 1 and 130 in year 2, inflation is . The index rises by five index points; dividing by 100 instead of 125 would wrongly report 5%. If it then falls to 127.4, inflation is . Use consecutive annual averages for annual-average inflation, or the same month in consecutive years for a twelve-month monthly rate: these are different comparisons.
To construct an index from a comparable price or basket cost, calculate new cost divided by base cost, multiplied by 100. A basket costing £250 in the base period and £275 later has index 110. If it is rebased at the later date, the earlier index becomes , but the increase from that earlier date is still 10%.
Purchasing power and real values
Nominal values are measured in money at current prices; real values adjust for price change to measure purchasing power or output at constant prices.
Continue this lesson.
You’re previewing NovaLearn without an account. Create a free account to read the rest.
Create free account