2.7 - Marginal decisions and utility
Many economic decisions concern one more unit rather than the whole amount already produced or consumed. In 2.7, learn how to calculate marginal values, distinguish total from marginal utility, and use diminishing marginal utility to explain willingness to pay and demand.
Calculating marginal values
A marginal value measures the change in a total when an activity increases by one additional unit.
The margin is the edge of a decision: whether to buy another journey, employ another worker or produce another item. Marginal cost is the extra total cost, marginal revenue the extra total revenue, and marginal profit the extra total profit associated with additional output. Sunk costs already incurred do not change because of this extra unit. They therefore cannot, by themselves, determine whether producing that unit is worthwhile.
Marginal and average values
When quantity rises by exactly one unit, the marginal value is simply the difference in totals. If quantity rises by several units, the ratio gives the average increment per added unit over that interval; it does not reveal the precise cost of each separate unit.
| Illustrative output (units) | Total cost (£) | Total revenue (£) | Total profit (£) |
|---|---|---|---|
| 0 | 10 | 0 | −10 |
| 1 | 16 | 12 | −4 |
| 2 | 25 | 24 | −1 |
| 3 | 38 | 36 | −2 |
Total profit is revenue minus cost. For unit 2, marginal cost is £9, marginal revenue £12 and marginal profit £3. Average cost at output 2 is , a different figure. Unit 3 adds £13 to cost but only £12 to revenue, reducing profit by £1. Output 2 has the highest profit of the listed choices even though it still makes a total loss. Whether to operate or close also depends on which costs can actually be avoided; the table alone does not establish that wider decision.
Total and marginal utility
Utility describes the satisfaction a consumer gains from consuming a good or service.
Total utility (TU) is satisfaction from all units consumed in the relevant period. Marginal utility (MU) is the additional satisfaction gained from one more unit. Utility units in a table are a hypothetical model of one person's preferences, not an objectively measured quantity that can be compared directly between people. A person can choose consistently without measuring satisfaction in numbers.
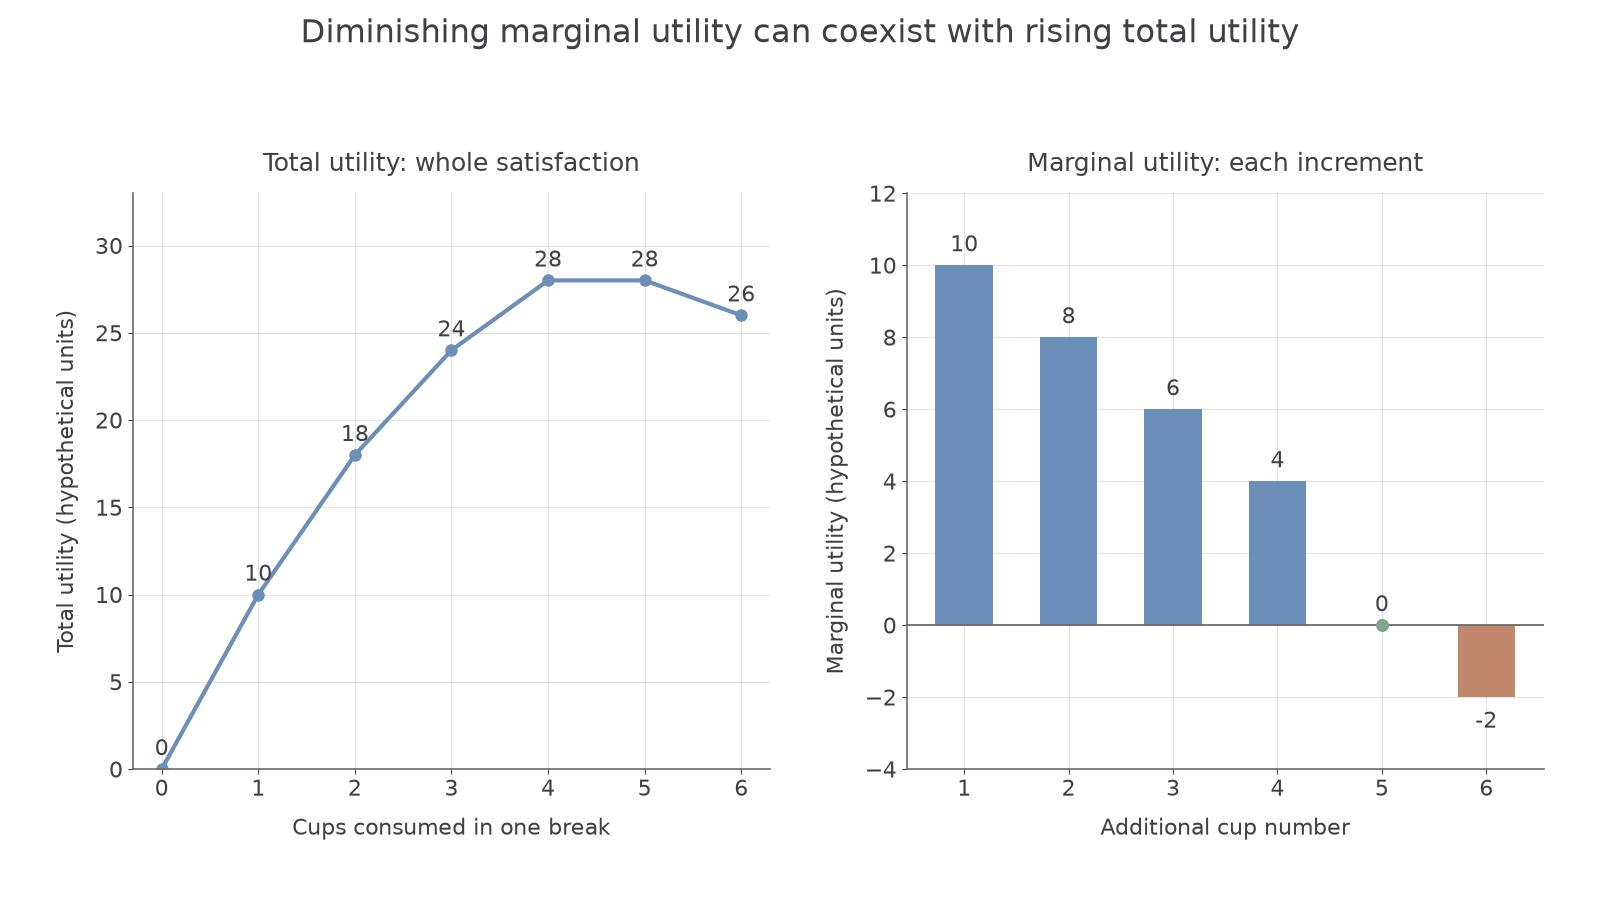
Suppose a thirsty person consumes cups of water during a short break. Their illustrative TU values are 0,10,18,24,28,28,26 for 0 through 6 cups. The respective marginal utilities of cups 1–6 are 10,8,6,4,0,−2. Cup 4 still raises TU, but by less than cup 3. At cup 5 TU is unchanged, so MU is 0. Cup 6 reduces TU, so MU is negative: more consumption is now unpleasant. Falling MU does not mean falling TU while MU remains positive.
The period matters. Satisfaction from a second cup now is not necessarily comparable to a second cup tomorrow after a long walk. Hold tastes and circumstances reasonably constant when using the model. A consumer also faces income and prices; recognising positive satisfaction does not prove an extra purchase is worthwhile if its opportunity cost is greater.
Diminishing marginal utility
Diminishing marginal utility means that successive additional units give smaller increases in satisfaction, other things equal.
The water example illustrates why: the first cups relieve substantial thirst; later cups meet a less urgent remaining want. To construct the diagram, put quantity consumed per break horizontally and hypothetical utility vertically. Plot total utility at each quantity; plot each unit's marginal increment separately. Joining the TU points shows its increases getting smaller. Marginal bars show the increments directly, including the zero and negative values. The bars are not average utility, which would be TU divided by quantity.
[DIAGRAM: asset_slug: total-marginal-utility; caption: Total utility and marginal utility from successive cups; description: Discrete TU 0,10,18,24,28,28,26 and MU 10,8,6,4,0,−2, with separate axes and correctly paired units.]
The principle is a model with limits. A first component may have little use until a matching component is obtained; collecting a set can raise the utility of a later item. Addiction, learning or network effects can also alter the pattern. These cases do not justify ignoring diminishing MU where the model fits: state which circumstances are being held constant and why an extra unit meets a less urgent need. MU can diminish while remaining positive throughout the quantities considered; it need not become negative.
Utility and willingness to pay
Diminishing marginal utility helps explain why a consumer is usually willing to pay less for successive units of a good.
A consumer compares the benefit of an extra unit with the satisfaction forgone by spending the money instead on something else. If the additional benefit diminishes, the maximum acceptable price for later units tends to fall. For example, one consumer's maximum willingness to pay for successive snacks might be £5,£3 and £1. At a price of £4 they buy only the first; at £2 they buy the first two; below £1 they may buy all three. A lower price makes additional lower-benefit units worth purchasing. This helps explain a downward-sloping individual demand relationship.
The argument holds the consumer's preferences and relevant circumstances fixed, and assumes money's marginal value is sufficiently stable over the small purchases. Hypothetical utility units cannot simply be read as pounds without specifying how utility is translated into willingness to pay. The income and substitution effects provide additional explanations for demand; diminishing MU is not a proof that every person's every demand curve must slope down in every case.
For divisible goods, the model's optimum occurs where the marginal benefit of expenditure on the last unit matches its opportunity cost. With indivisible items, use the actual available choices rather than insisting on an exact equality. In the snack example, a consumer can rationally buy two at £2 despite the second unit's maximum willingness to pay being £3, because the third unit is worth only £1. Changing income, tastes or the price of other goods can alter those valuations and shift demand rather than create movement along an unchanged curve.
Quick recap
Marginal values are changes in totals per extra unit, while average values divide the whole total by quantity. TU can rise while MU falls. Diminishing MU can explain falling willingness to pay, subject to the model's assumptions.