3.3 - Revenue, profit and marginal choices
High sales revenue can coexist with a loss, while an accounting profit can leave an owner no better off than the best alternative use of their resources. Learn to calculate total, average and marginal revenue and profit, then use marginal comparisons to explain different output choices.
Three measures of revenue
Total revenue (TR) is the money received from selling output during a period. Average revenue (AR) is revenue per unit sold; when every unit is sold at the same price, AR equals that price. Marginal revenue (MR) is the additional total revenue from additional sales. Revenue is measured before subtracting costs, so it is not profit.
An illustrative seller faces the following choices, charging the same price on all units in each plan:
| Quantity per day | Price per unit | TR per day | AR per unit | MR of latest unit |
|---|---|---|---|---|
| 0 | — | £0 | — | — |
| 1 | £10 | £10 | £10 | £10 |
| 2 | £9 | £18 | £9 | £8 |
| 3 | £8 | £24 | £8 | £6 |
| 4 | £7 | £28 | £7 | £4 |
| 5 | £6 | £30 | £6 | £2 |
| 6 | £5 | £30 | £5 | £0 |
| 7 | £4 | £28 | £4 | −£2 |
The fourth sale raises TR from £24 to £28, so MR is £4, not the new price £7. Lowering the price also reduces receipts from the first three units. In this uniform-price, downward-demand example, MR is below AR after the first discrete sale. If a firm can instead sell any relevant quantity at an unchanged market price, each extra unit adds that price and AR = MR = price. The downward-sloping case is not universal.
At Q = 5, TR is £30 and AR is £6. AR is a ratio of revenue to units, not a fraction of total cost. At Q = 0, AR is undefined. If quantity changes by ten units, divide the revenue increment by ten to obtain MR per unit; do not report the whole increment as a per-unit measure.
Reading revenue curves
A revenue graph must distinguish totals from per-unit measures. Total revenue against output rises where MR is positive, reaches its smooth maximum where MR is zero, and falls where MR is negative. Average revenue is the demand curve in the uniform-price model: it shows the price at which the quantity can be sold.
[DIAGRAM: asset_slug: revenue-and-profit; caption: Total and marginal revenue identify different output choices; description: Consistent illustrative TR and TC curves above AR, MR and MC show revenue maximisation at MR zero and profit maximisation where rising MC crosses MR.]
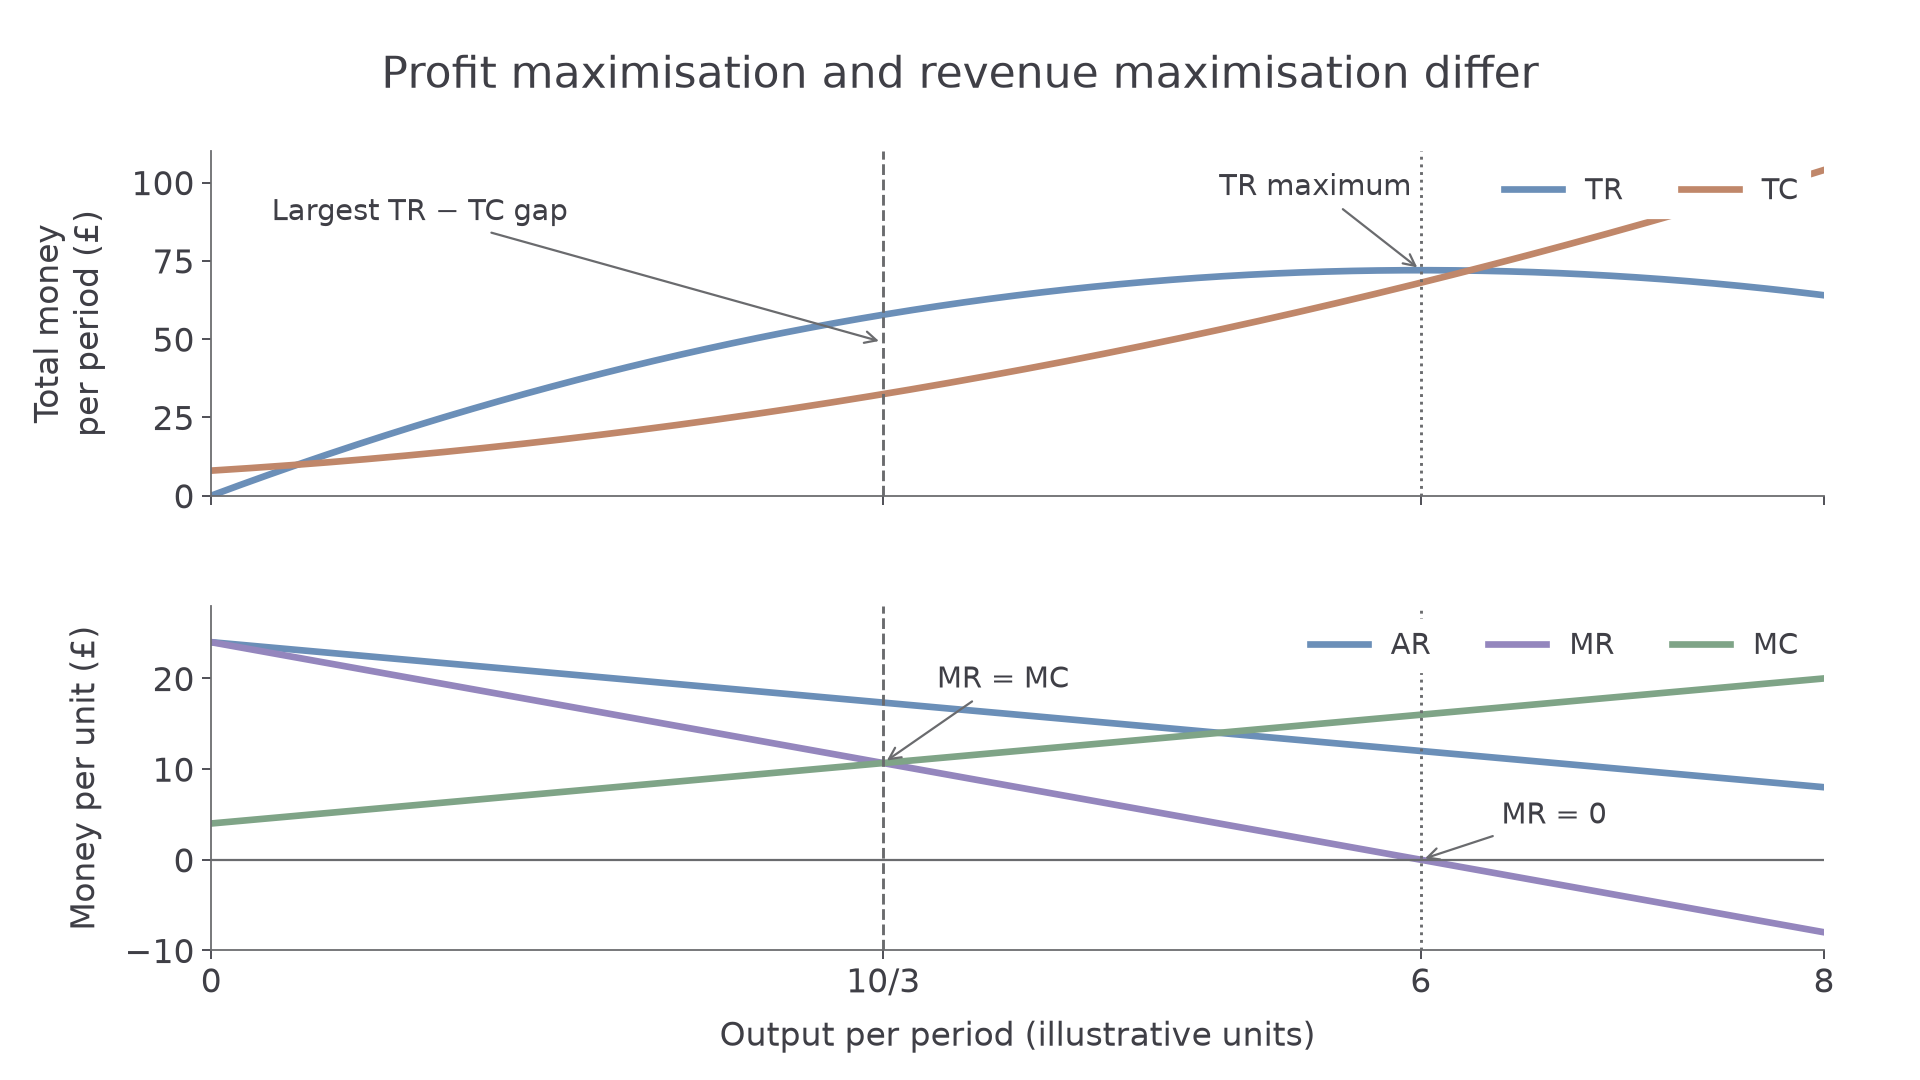
The illustrative linear demand is , so and smooth . These equations show why MR has the same vertical intercept but twice the downward slope of this linear AR curve. Revenue peaks at Q = 6, where MR = 0. This twice-the-slope result is specific to linear demand; it should not be copied onto every demand shape.
To sketch, label output horizontally. Use a total-money axis for TR and a separate money-per-unit axis for AR and MR. Align the output scales. The zero of MR must lie directly below the peak of TR. The vertical height of AR at an output is its selling price; multiplying that height by output gives a rectangle whose area represents TR in the per-unit graph.
On a smooth demand curve, lowering price increases TR when demand is elastic, and lowers TR when demand is inelastic; TR peaks at the unit-elastic point of the linear curve. For finite changes, calculate the two revenues directly. An initial-base PED magnitude of exactly one for a large change does not itself guarantee identical revenues. The table in the first part is a discrete example with two outputs sharing the maximum TR; it need not match the single maximum of this separate continuous model.
Calculating profit and loss
Profit is total revenue minus total cost for the same output and period. A negative result is a loss. Use economic cost when calculating economic profit, and check that the dataset says what its costs include.
An illustrative firm sells 400 units at £15 each. Revenue is £6,000. If total economic cost is £5,200, economic profit is £800. AR is £15 and ATC is £13, so profit per unit is £2 and £2 × 400 reproduces £800. Profit per unit is the difference between average revenue and average cost; total profit is that difference multiplied by quantity.
If price falls to £12 at the same output and cost, TR is £4,800 and economic profit is −£400, a £400 loss. The firm still has substantial revenue. Revenue, profit and cash flow are different: cash flow tracks the timing of cash receipts and payments, while the cost/revenue calculation here concerns a stated period's economic activity.
Suppose profit rises from £800 to £1,000. Its percentage increase is . A profit margin measures profit as a share of revenue: £800/£6,000 × 100 = 13.33%, to two decimal places. If that margin changes to 15%, the change is 1.67 percentage points, not 1.67% growth in profit. A percentage change from zero profit is undefined; when comparing losses, describe clearly whether the loss is shrinking or growing.
Total cost includes both fixed and variable cost. Ignoring a fixed bill can turn an apparent profit into a loss. Conversely, when judging the extra output rather than the whole operation, the relevant comparison is the extra revenue with the extra cost. Average profit per unit need not be greatest where total profit is greatest.
Continue this lesson.
You’re previewing NovaLearn without an account. Create a free account to read the rest.
Create free account