2.2 - Demand and related goods
Demand means willingness and ability to buy, rather than simply wanting a product. Learn how prices and other influences change purchasing decisions, how individual demands become market demand, and how demand for related goods is connected.
Price and quantity demanded
A demand curve shows the quantity buyers are willing and able to purchase at different prices during a stated period, holding other relevant influences constant.
For ordinary goods, a lower own price encourages a higher quantity demanded. The good becomes cheaper relative to alternatives, encouraging substitution towards it. A given income can also buy more, increasing purchasing power. These explain the usual downward slope; they are not a claim that every buyer purchases every good in the same way.
An illustrative weekly demand schedule for a product is:
| Price per unit | Quantity demanded per week |
|---|---|
| £2 | 22 units |
| £4 | 16 units |
| £6 | 10 units |
Plot price vertically and quantity horizontally. Mark the three price–quantity pairs and join them with D; this illustrative linear schedule is . The axes must include variables, units and the period. Quantity demanded is a flow per period, so “16 per week” differs from a stock of 16 items at one moment.
A price fall from £4 to £2 causes an extension of demand from 16 to 22 along the same curve. A price rise causes a contraction. These are changes in quantity demanded caused by the good's own price, not shifts of the demand curve. A curve represents the whole relationship, not one particular quantity.
[DIAGRAM: asset_slug: h460-foundations-demand-move; caption: A price fall extends quantity demanded along D, while a non-price change shifts the whole curve; description: Two exact illustrative demand panels, original Q28 minus3P, movement from P4 Q16 to P2 Q22, and shifted Q34 minus3P showing Q16 to22 at fixed P4.]
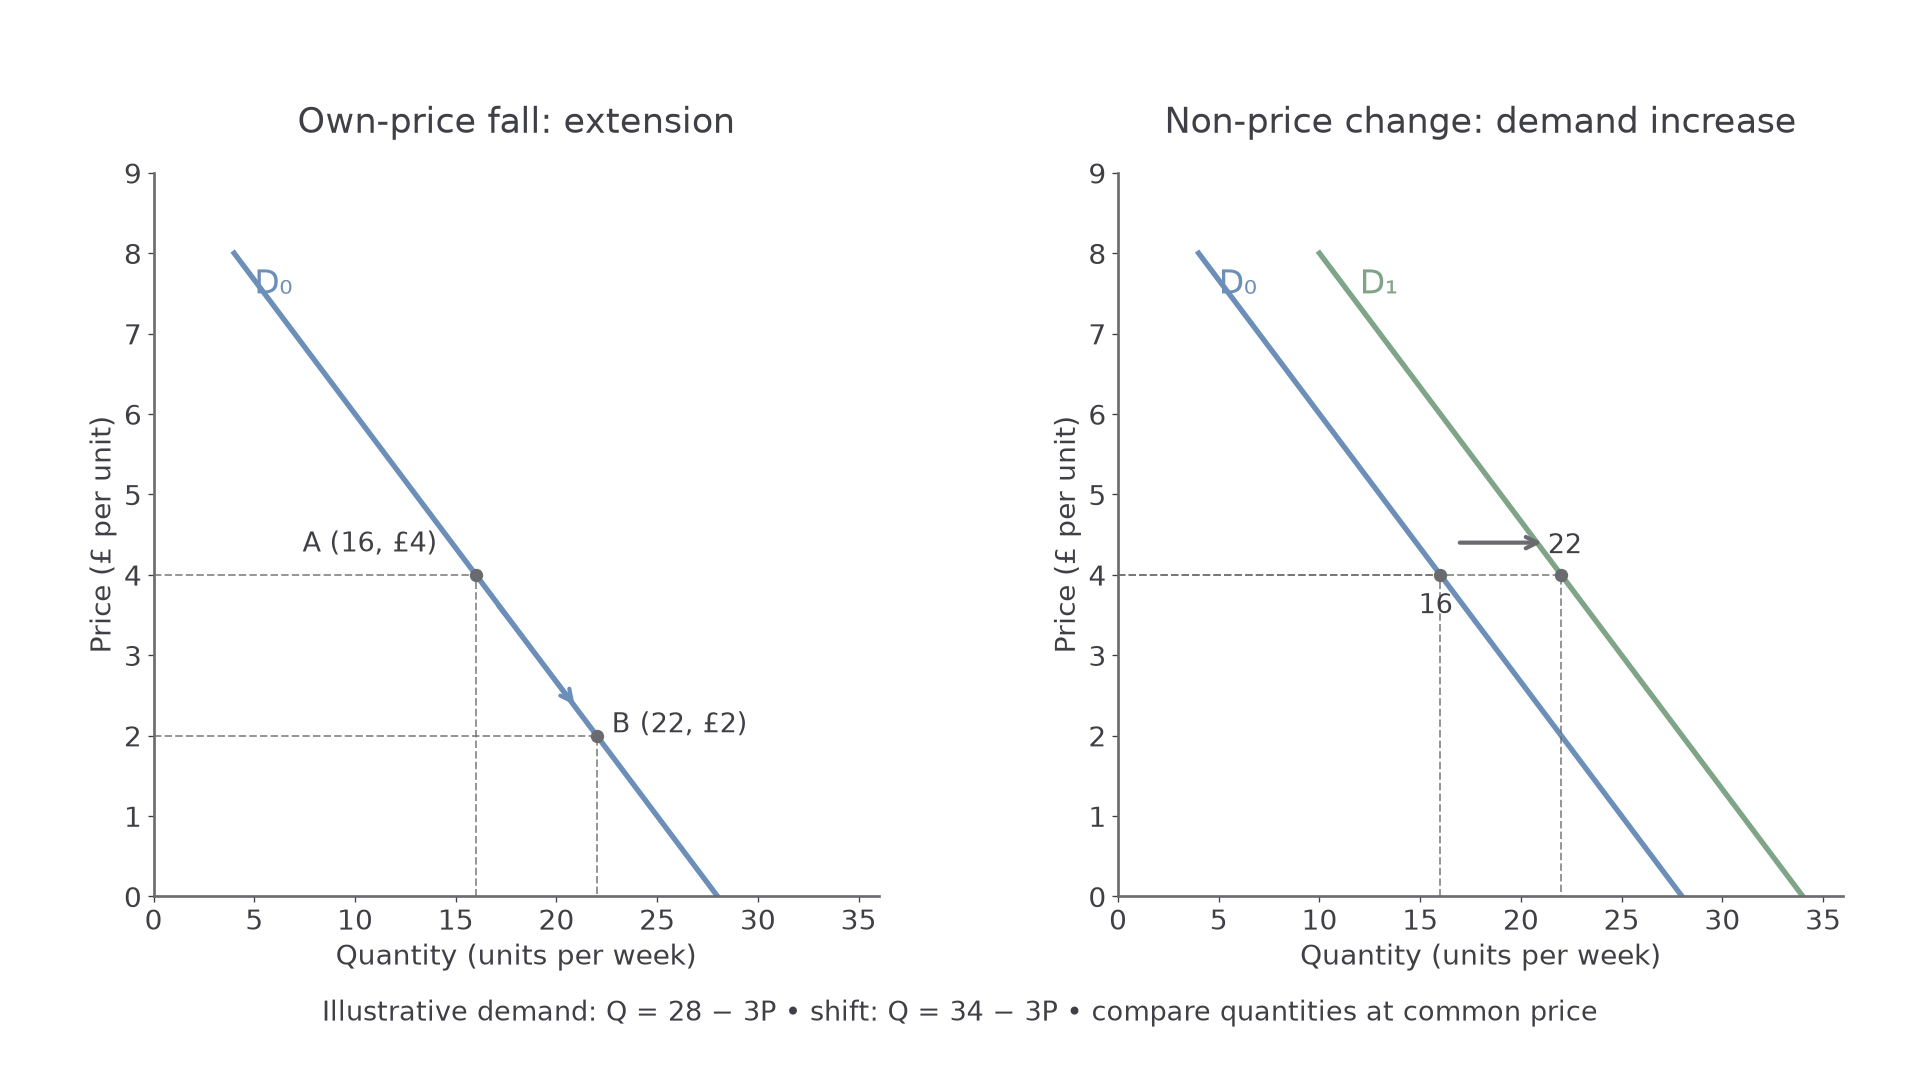
The left panel changes own price with other demand conditions unchanged. The right panel changes demand at each price; it is a different causal event.
Individual and market demand
Market demand is the sum of individual quantities demanded at each common price.
Suppose two illustrative buyers are the entire market. At £2, A wants 12 units and B wants 10: market demand is 22. At £4, A wants 8 and B wants 8: market demand is 16. At £6, A wants 4 and B wants 6: market demand is 10. Add quantities horizontally, using the same price, good and period. Adding prices would not tell us how many units the market wants at a particular price.
[DIAGRAM: asset_slug: h460-foundations-market-demand; caption: Horizontal summation adds the two buyers' quantities at each price; description: Three exact plotted curves A Q16 minus2P, B Q12 minusP and market Q28 minus3P for P0to6, highlighting at P4 individual quantities8 and8 and market16.]
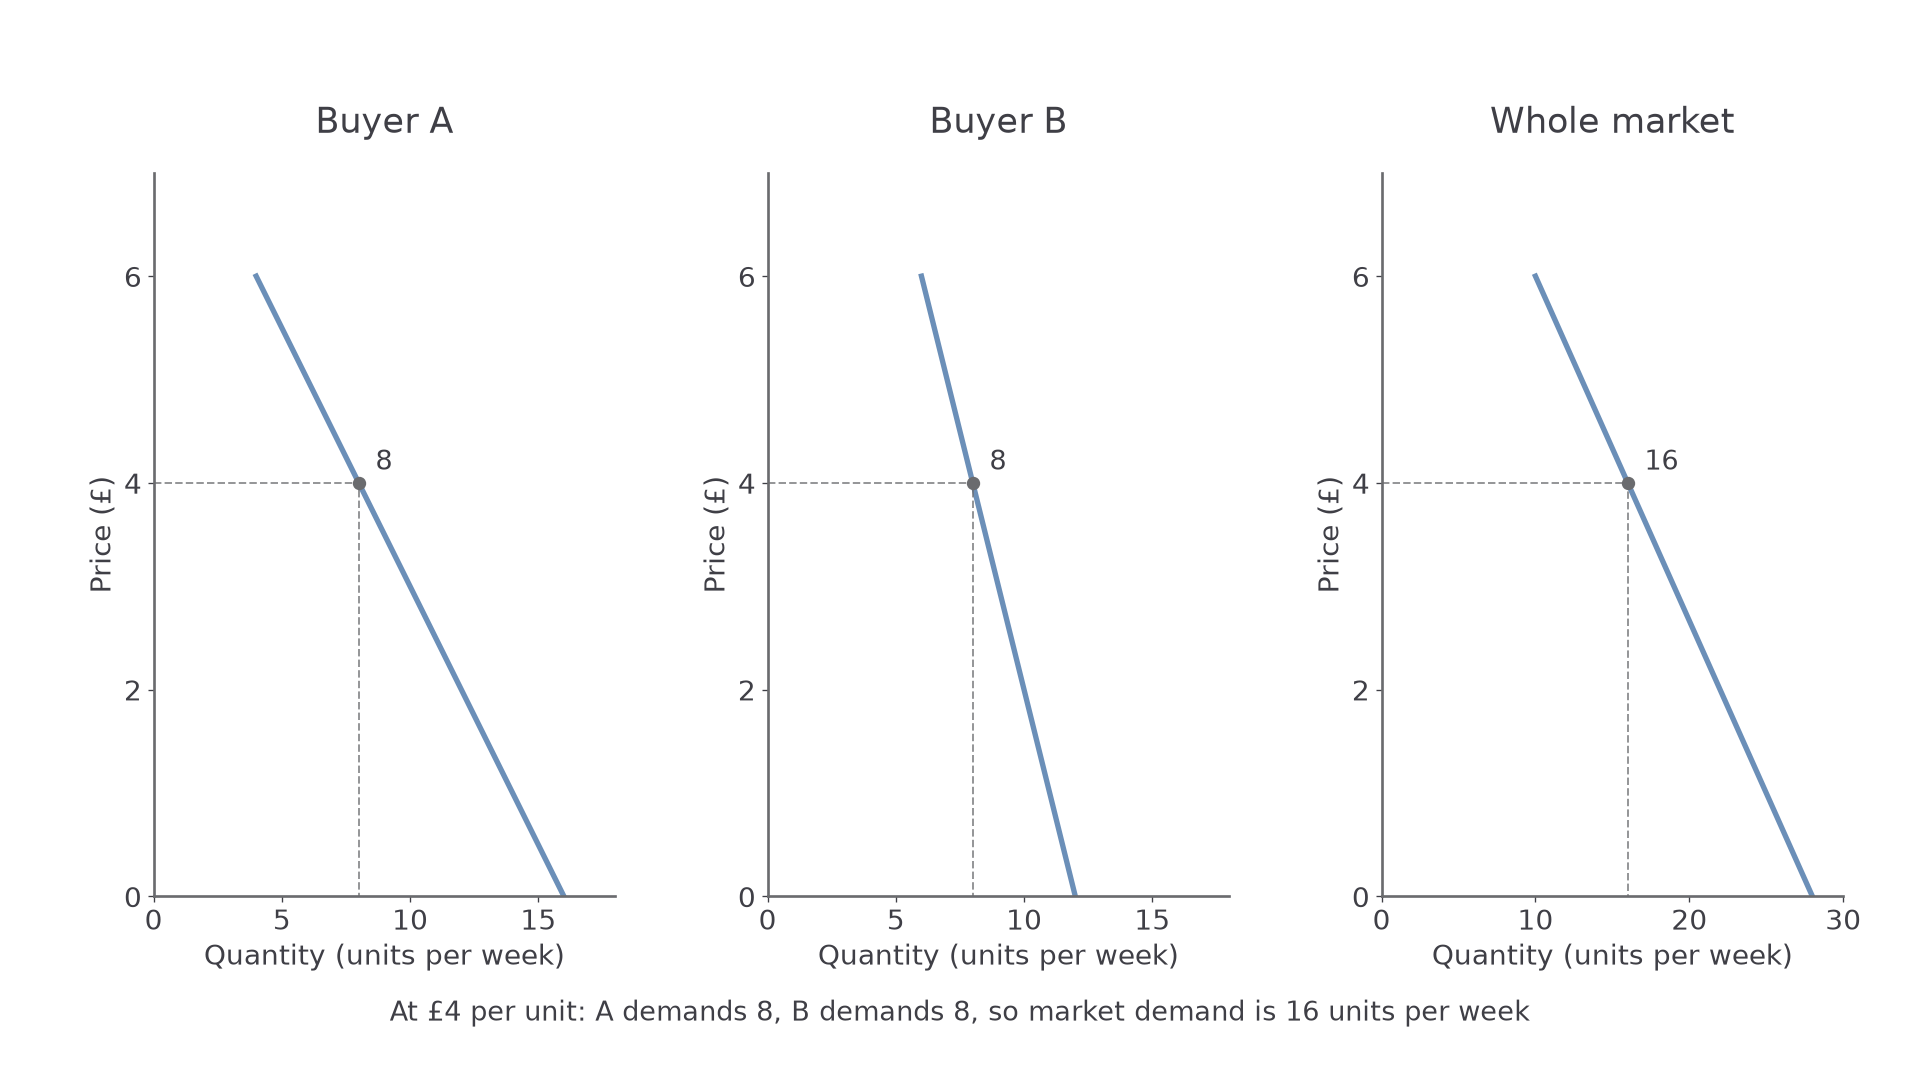
At £4, 8 units plus 8 units give 16 units of market demand per week. These two illustrative buyers form the complete model market.
To construct market demand, make a shared price column, record each buyer's quantity beside it and add those quantities row by row. Plot the totals against the common price. If an individual wants zero at a high price, use zero, not a negative purchase quantity. Beyond such a point, the market curve's shape may change, so blindly adding linear equations outside their valid range is misleading.
The number and composition of buyers matter. More households in an area can increase market demand even when each existing household's demand is unchanged. A market curve does not imply all consumers have identical preferences or incomes. It combines their choices into a quantity at each price.
Shifts of demand
A non-price influence shifts demand when it changes the quantity buyers want at each possible own price.
An increase in demand shifts D right; a decrease shifts it left. In the right panel of the first diagram, the new illustrative relationship gives 22 instead of 16 units at £4. The comparison holds own price fixed to isolate the shift. It does not say the eventual market price must stay £4; equilibrium is considered in 2.5.
Income affects purchasing power. Higher income increases demand for a normal good but reduces demand for an inferior good, as buyers switch towards preferred alternatives. Inferior describes an income relationship, not necessarily poor quality. Which category a good belongs to depends on consumers and the income range; it cannot be inferred solely from a low price.
Tastes, information and advertising can change perceived desirability. Population and the number of buyers alter market demand. Expectations about future prices or availability may bring purchases forward, though buyers need storage and money. Prices of related goods affect the relative attraction of the good or the usefulness of consuming it together with something else.
For example, an illustrative bus-price rise can increase demand for train journeys as some passengers switch. At the same train fare, more journeys are demanded. This is a train-demand shift caused by a different good's price, rather than movement along train demand. Conversely, higher income can reduce demand for a particular low-cost service if customers switch to a preferred alternative.
Joint, competitive and composite demand
Demand relationships arise because goods may be consumed together, used as alternatives or demanded for several uses.
Joint demand concerns complements used together, such as printers and compatible ink. A fall in printer prices can increase printer purchases and therefore demand for ink at each ink price: ink D shifts right. A higher ink price can reduce demand for the related printers. Complementarity need not require a fixed ratio, and compatibility matters; one printer brand's ink is not automatically a complement for every printer.
Competitive demand concerns substitutes serving a similar purpose, such as tea and coffee for some consumers. A fall in the coffee price makes coffee relatively attractive and can reduce demand for tea: tea D shifts left. The strength depends on whether buyers regard them as close alternatives. It is a shift in tea demand, while the own-price fall produces a movement along coffee demand if its other conditions stay unchanged.
Composite demand exists when the same good is demanded for different uses. Wheat can be demanded for bread, animal feed and other products. Additional demand from bread producers increases total demand for wheat at each wheat price. If the wheat price then rises, users in other activities may reduce their quantity demanded along their demand curves. One use therefore affects the scarcity faced by another without bread and animal feed being substitutes in consumption.
[DIAGRAM: asset_slug: h460-foundations-related-demand; caption: Complements, substitutes and multiple uses produce different demand shifts in the affected market; description: Three exact illustrative shift panels showing ink demand right after a printer-price fall, tea demand left after a coffee-price fall, and total wheat demand right after more bread demand, at fixed reference price4.]
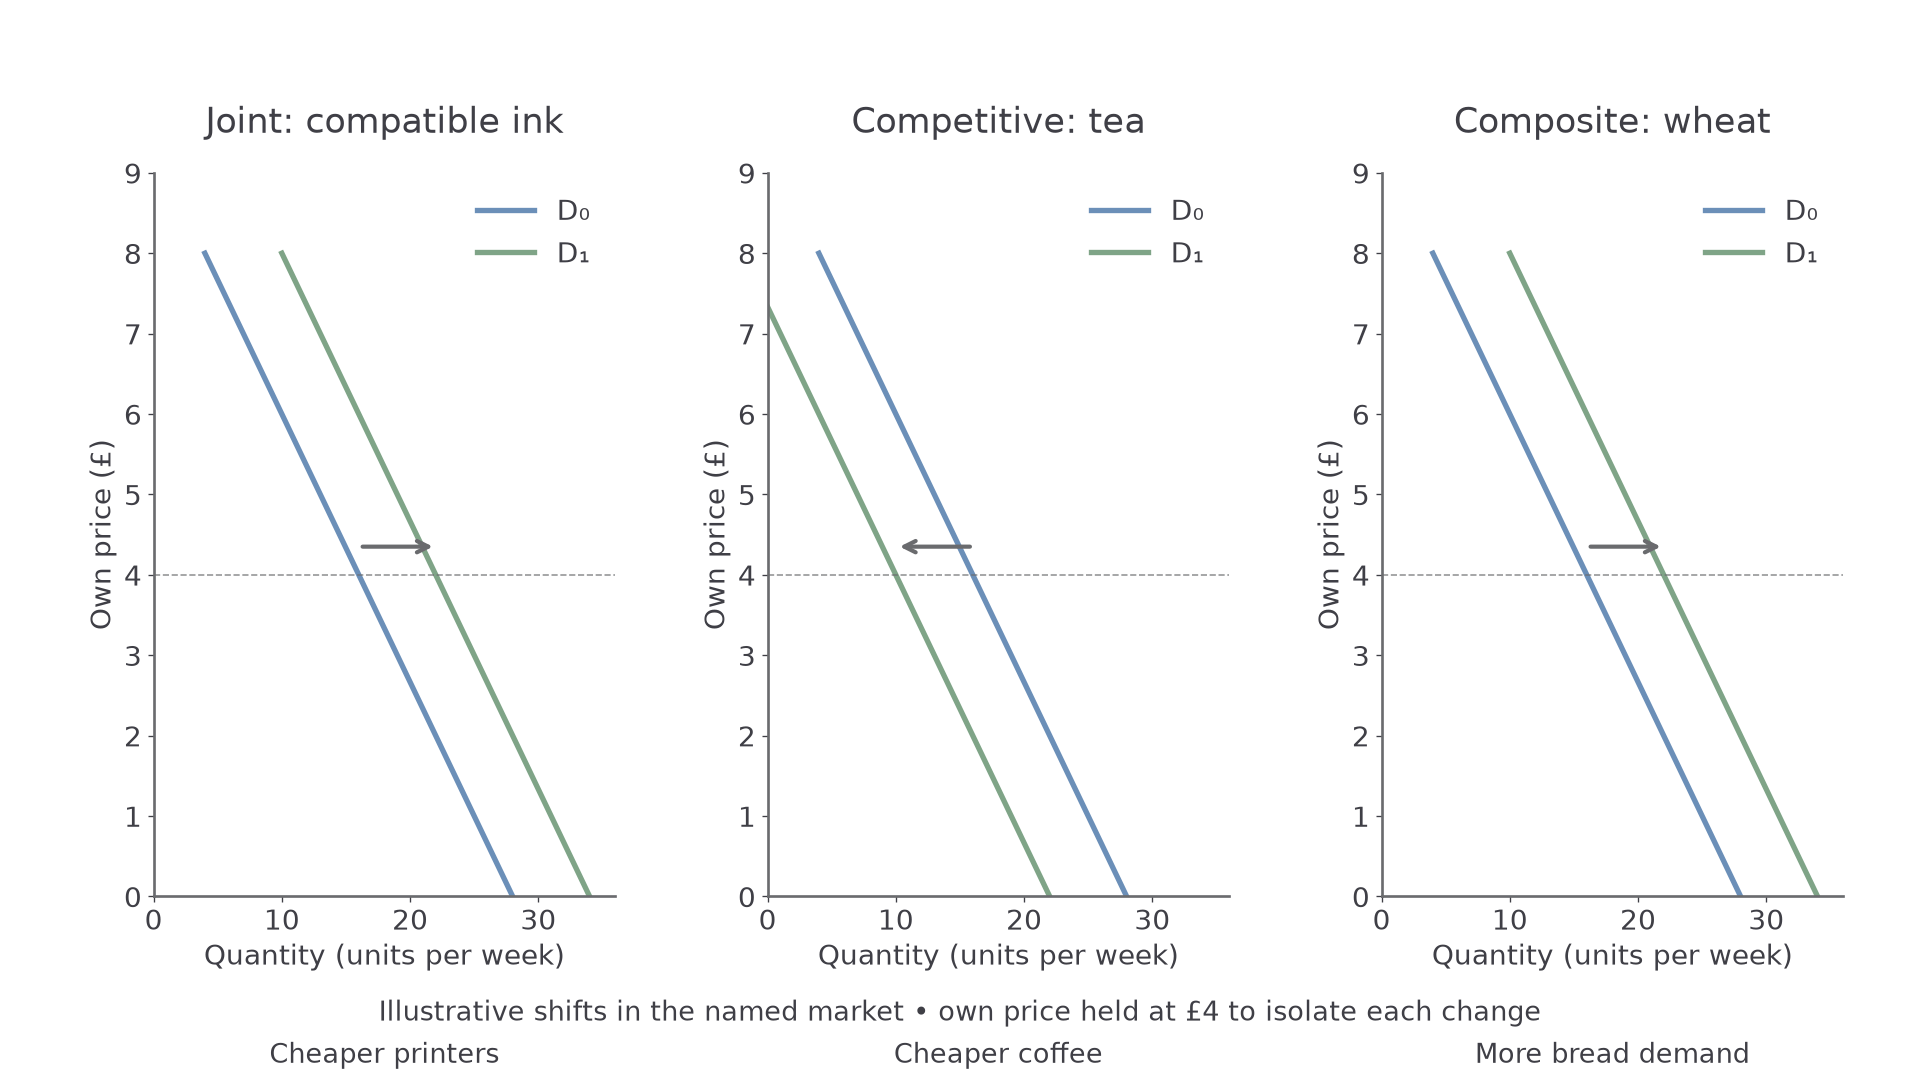
Each panel identifies the affected market. The cause occurs elsewhere; own price is held at the reference level to show the change in demand.
To draw a related-demand shift, first name the market on the axes. Identify whether the change affects that good's own price or a non-price determinant. Then draw and label D0 and D1 in the appropriate direction, comparing quantities at a common own price. Do not shift every curve automatically: the distinction depends on which market you are analysing.
Quick recap
Own-price changes cause extensions or contractions along demand. Other determinants shift the relationship. Market demand adds quantities at common prices; joint, competitive and composite demand explain how other goods and uses can change those quantities.