3.2 - Monetary policy and transmission
Monetary policy influences spending, borrowing and expectations to pursue macroeconomic objectives. Trace interest rates, money supply, exchange rates and quantitative easing through to output and inflation, then judge their effectiveness using the source of the problem and the time needed for policy to work.
Interest rates, money and targets
Monetary policy uses central-bank decisions about monetary conditions to influence the economy, rather than changing government taxes and expenditure.
An interest rate is the price of borrowing or the return to saving, expressed as a percentage over a period. In the UK, the Bank of England's Monetary Policy Committee sets Bank Rate, which influences commercial lending and deposit rates. Rates faced by individual borrowers also depend on risk, competition and contract terms. A Bank Rate change is not automatically passed on in full to every borrower.
The money supply is a stock of money at a point in time, with different measures including different liquid assets. In a simple money-market model, money demand slopes down against the interest rate: holding money sacrifices the interest obtainable on other assets, so a higher rate reduces the desired money balance, other things equal. If nominal money supply is assumed fixed by the central bank, its curve is vertical. Increasing it moves the intersection down the demand curve and lowers the equilibrium interest rate.
[DIAGRAM: asset_slug: ocr_h460_money_supply_rates; caption: In a simple fixed-supply money-market model, more money supply lowers the interest rate; description: Exact illustrative money-demand graph with money supply shifting from 80 to 110 and the interest rate falling from 6% to 3%.]
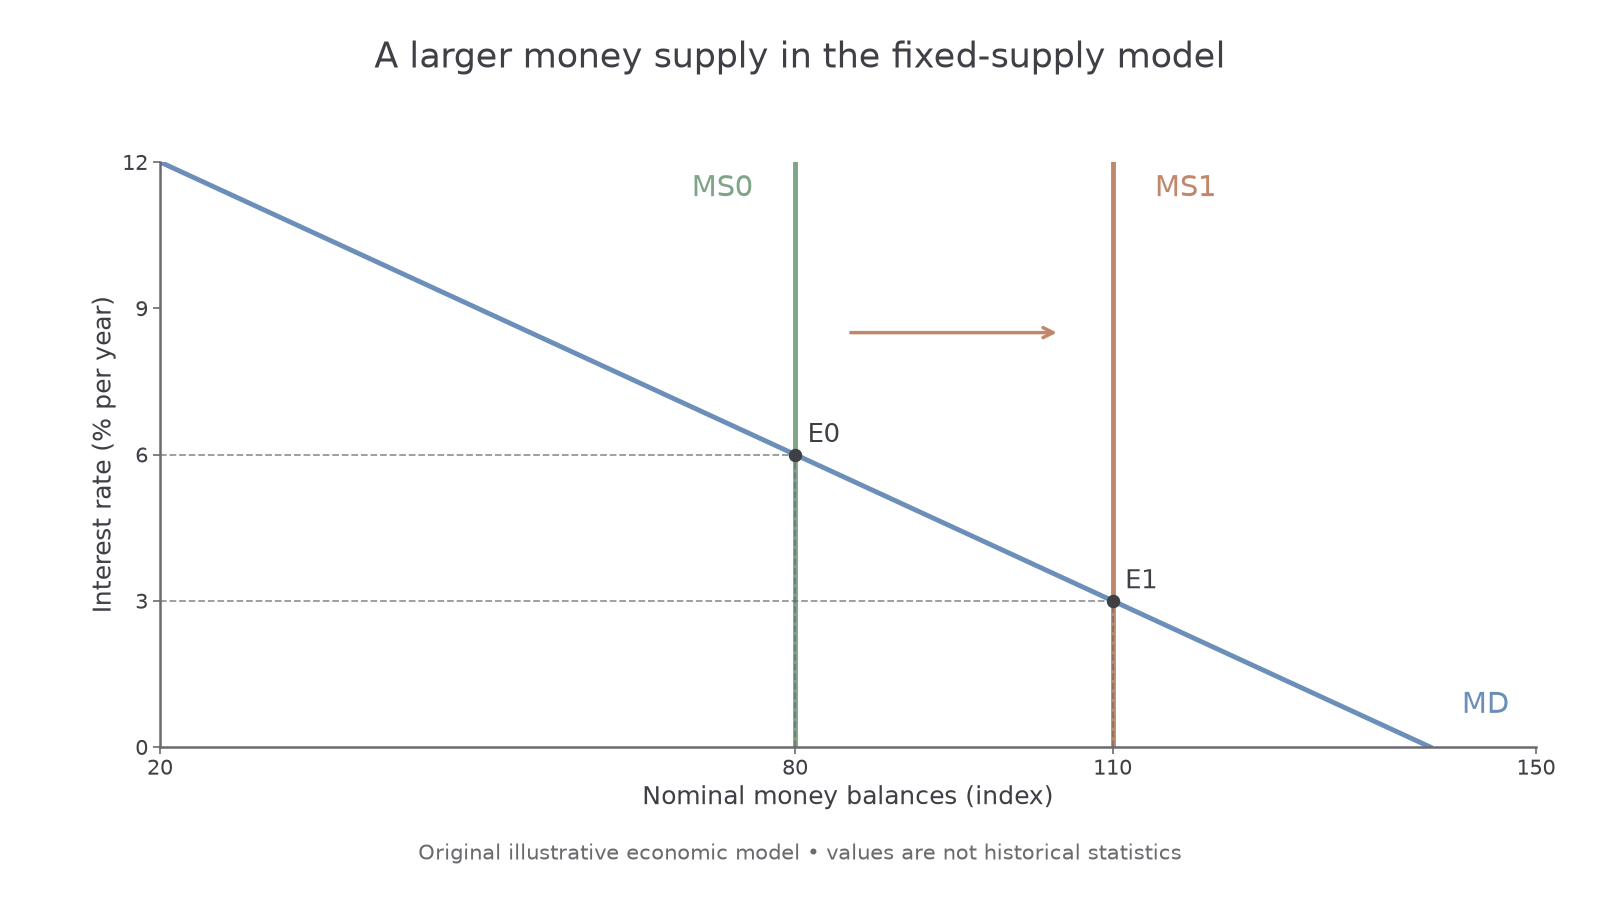
This is a model under stated assumptions. In modern UK practice, the central bank normally sets its policy interest rate, while commercial-bank lending creates much deposit money. Banks do not mechanically multiply each extra reserve into a fixed amount of new lending. Policy, credit demand, risks and bank constraints affect the outcome. QE creates central-bank reserves and can increase deposits when assets are purchased from non-bank sellers; the later effect on spending still needs an explanation.
An inflation target gives policy a stated goal and can anchor expectations if people believe action will return inflation to it. The UK target is 2% annual CPI inflation, checked against Bank of England guidance on 30 September 2026. It is a target for the rate of price increase, not a price-level ceiling or a guarantee that inflation is always exactly 2%. Credibility can reduce the likelihood of households and firms building persistently high expected inflation into wage and price decisions. An above-target inflation forecast may motivate tightening: the AD contraction diagram in the next section illustrates a route to lower price pressure, rather than a target of “2” on a price-index axis.
From interest rates to spending
Interest-rate changes influence aggregate demand through linked decisions by borrowers, savers and firms.
A higher borrowing rate makes credit-financed purchases less attractive. Households may postpone a car purchase; those with variable-rate mortgages may have less income left for other consumption. A higher saving return raises the reward for postponing consumption. Firms may cancel projects whose expected return no longer covers financing costs, reducing investment. These channels lower C and I at each price level and shift AD left. Lower rates can reverse these incentives, although unwilling borrowers do not have to take out loans just because finance is cheaper.
For an illustrative interest-only loan with principal £200,000, a rate increase from 3% to 5% raises annual interest from £6,000 to £10,000, a £4,000 increase. This example holds the principal constant and excludes fees and repayments; a repayment mortgage needs a different calculation. The interest payment is not itself household consumption of newly produced goods, but it changes the budget available for spending.
The income effect on savers can offset part of the contraction. A saver may spend more of higher interest income, while a borrower cuts spending. The aggregate outcome depends on how many households face each effect and how much they spend from a change in resources. Fixed-rate debts delay the cash-flow channel; a high debt burden can amplify it when rates reset.
[DIAGRAM: asset_slug: ocr_h460_monetary_ad_transmission; caption: AD contraction after higher rates and AD expansion after effective monetary easing, with unchanged SRAS; description: Exact illustrative two-panel AD-SRAS graph showing contraction from output 100 and price index 100 to output 90 and price index 90, and expansion to output 110 and price index 110.]
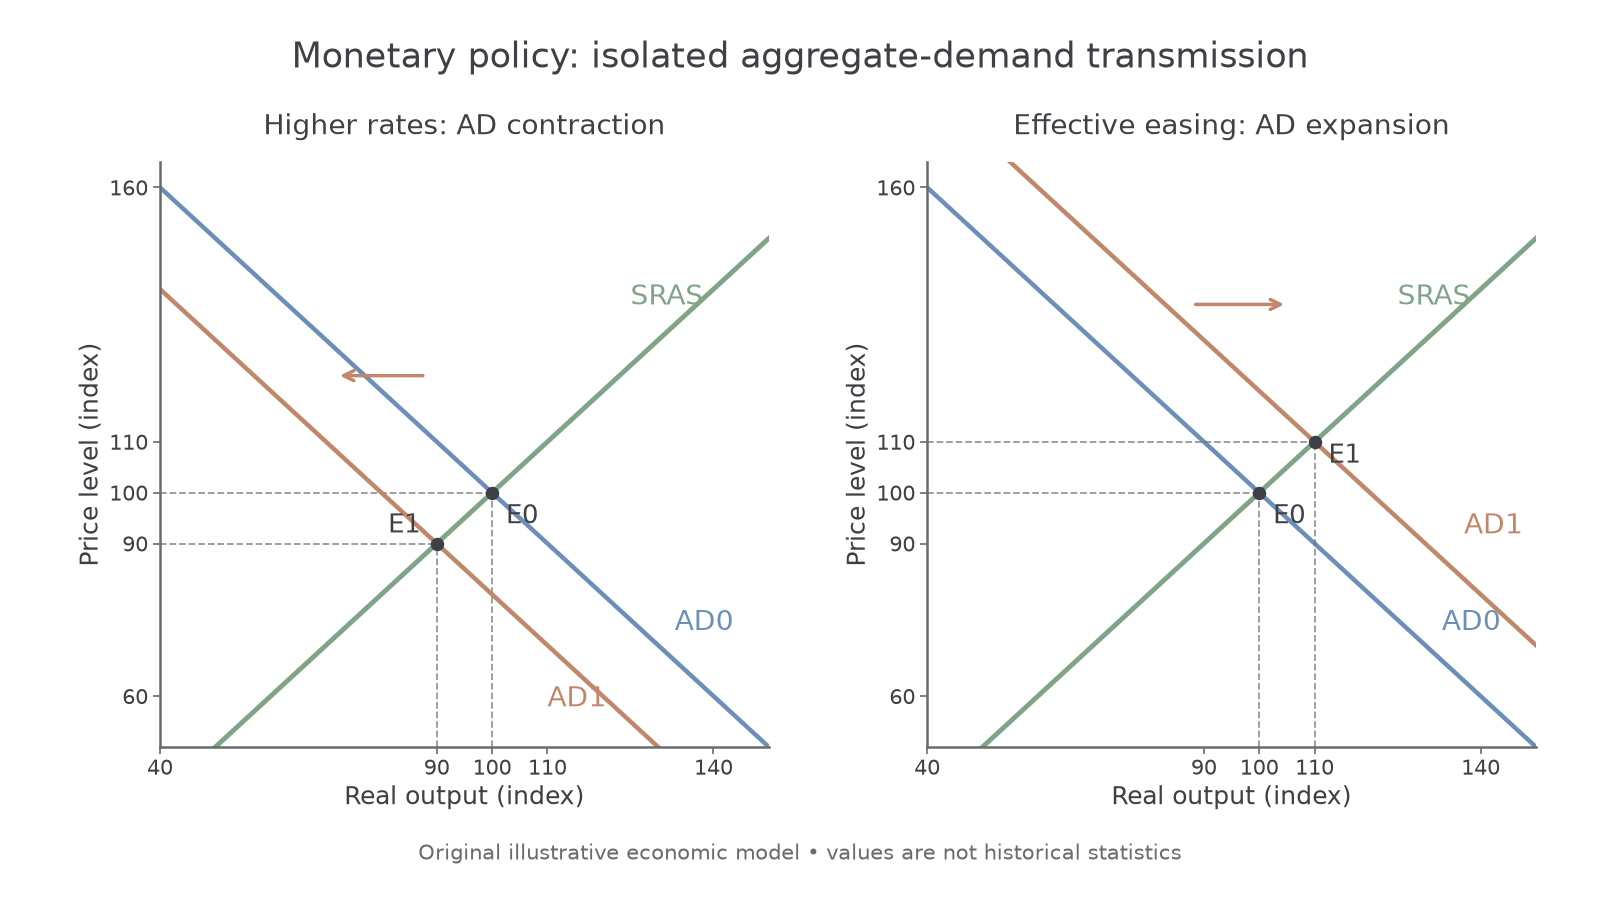
The left panel isolates a contractionary demand effect; the right isolates successful easing, including a possible QE effect. SRAS is unchanged in both panels. These are comparative price-level diagrams. They support a mechanism for lower or higher inflationary pressure over time, but do not show an inflation rate of 90% or 110%.
The exchange-rate channel
Monetary policy can influence exchange rates and thereby change both spending on domestic output and the cost of imported inputs.
Other things equal, a higher domestic interest rate relative to rates abroad can attract investors seeking returns on domestic-currency assets. Buying those assets increases demand for the currency, tending to cause an appreciation under a floating exchange rate. Exchange rates also depend on expectations, risk and other countries' decisions, so an appreciation is a possible channel rather than an automatic result.
If £1 rises in value from 1.20 US dollars to 1.30 US dollars, a £100 domestic product rises in its US-dollar price from 120 US dollars to 130 US dollars, assuming its sterling price is unchanged. An imported product priced at 120 US dollars falls in sterling cost from £100 to about £92.31. Exports can become less price competitive and imports more attractive. If quantities respond sufficiently, net exports fall and AD shifts left, as in the contraction panel above.
Cheaper imported fuel and components can also reduce firms' unit costs, shifting SRAS right/down. Cheaper imported consumer products can directly reduce measured inflation. This cost channel can ease the output loss from weaker AD; the net effect depends on exposure to imports and on demand responsiveness. Do not shift SRAS left simply because exporters sell less: lost sales are a demand effect.
Lower interest rates may contribute to depreciation, stimulating net exports but raising imported costs. A country relying heavily on imported energy may therefore face an inflationary cost effect as well as increased AD. Long contracts and price-setting in foreign currency can delay the change, and firms may absorb exchange changes in profit margins rather than changing customer prices immediately.
Quantitative easing and bond yields
Quantitative easing is central-bank asset purchasing intended to ease monetary conditions, particularly when further policy-rate cuts offer limited scope.
Under QE, the central bank buys assets such as government bonds, paying with newly created central-bank reserves. When the seller is a non-bank investor, the banking system credits its deposit and receives reserves. This is asset purchase, not a direct gift of money to every household and not the same as a government choosing more public expenditure.
Extra demand for bonds tends to increase their market prices. A bond's fixed annual coupon then represents a smaller percentage of its price: price and current yield move inversely. For an illustrative bond paying £4 annually, a rise in price from £80 to £100 reduces current yield from to . Current yield is a simplified measure; a full yield to maturity also accounts for repayment value and timing.
Continue this lesson.
You’re previewing NovaLearn without an account. Create a free account to read the rest.
Create free account