Appendix 1 2(d)(ii) - Student's t-test and group differences
Learn to compare two means using a suitable t-test, including sample variation, independent groups and paired observations. Interpret the statistic alongside the size of the difference and the geographical quality of the sampling.
Choosing the comparison design
An enquiry about whether two groups differ needs a test that matches how observations were collected.
t-test
A statistical test of a population mean or difference between population means, using a sample mean difference in relation to its estimated standard error. Here we examine comparisons between two groups or conditions.
Use measurements for which a mean is meaningful, such as infiltration rate in millimetres per hour. A t-test of means is different from a test of correlation between two variables or a test of association between category counts. A numerical code for a category, such as 1 = bus and 2 = car, does not turn that category into a meaningful quantitative measurement.
In an independent-samples design, one set of sampled units belongs to group A and another set belongs to group B. For example, compare separately selected grassland and bare-soil plots. Independence concerns observations, not just labels: many readings within one grass plot are repeated measurements of that plot, not many independent grassland sites.
In a paired design, each unit has a natural counterpart. Measuring the same nine plots before and after treatment gives nine pairs. Measurements from nine unrelated grass plots and nine unrelated bare plots are not paired merely because they are arranged in matching spreadsheet rows. Matching two locations on a justified characteristic can create a paired design, but the match must be real and established by the study.
For small-sample t procedures, check for plausible approximately normal population distributions, especially strong skew or outliers. For a paired test, it is the distribution of the within-pair differences that matters. The usual pooled independent Student test additionally assumes equal population variances. When that equality is not defensible, an independent Welch t-test uses a different variance treatment and degrees of freedom. Use the procedure specified and justified by the design; do not combine one test's statistic with another's critical-value rule.
Calculating sample variation
The same difference between means is more convincing when measurements within each group vary little than when they are highly scattered.
Use the sample variance to estimate population variation. It differs from a descriptive population variance because the divisor is n − 1 rather than n. Estimating the mean from the sample leaves n − 1 freely varying deviations: once all but one are known, their zero sum fixes the last.
Here is the sample mean, is sample variance and s is sample standard deviation. Standard deviation has the original measurement unit; variance has its square.
Consider original illustrative infiltration rates, not actual fieldwork: five independently sampled grass plots have values 8, 9, 10, 11 and 12 mm per hour. Their sum is 50 and mean is 10 mm per hour. Deviations are −2, −1, 0, 1 and 2; squared deviations sum to 4 + 1 + 0 + 1 + 4 = 10. The sample variance is 10/4 = 2.5 squared rate units, and the standard deviation is approximately 1.581 mm per hour.
Five independently sampled bare plots have values 4, 5, 6, 7 and 8 mm per hour, with mean 6, the same squared-deviation sum and the same sample variance 2.5. We stipulate comparable methods, independent selection, approximately normal populations and equal population variances for the worked teaching example. A small tidy dataset cannot itself demonstrate all those assumptions.
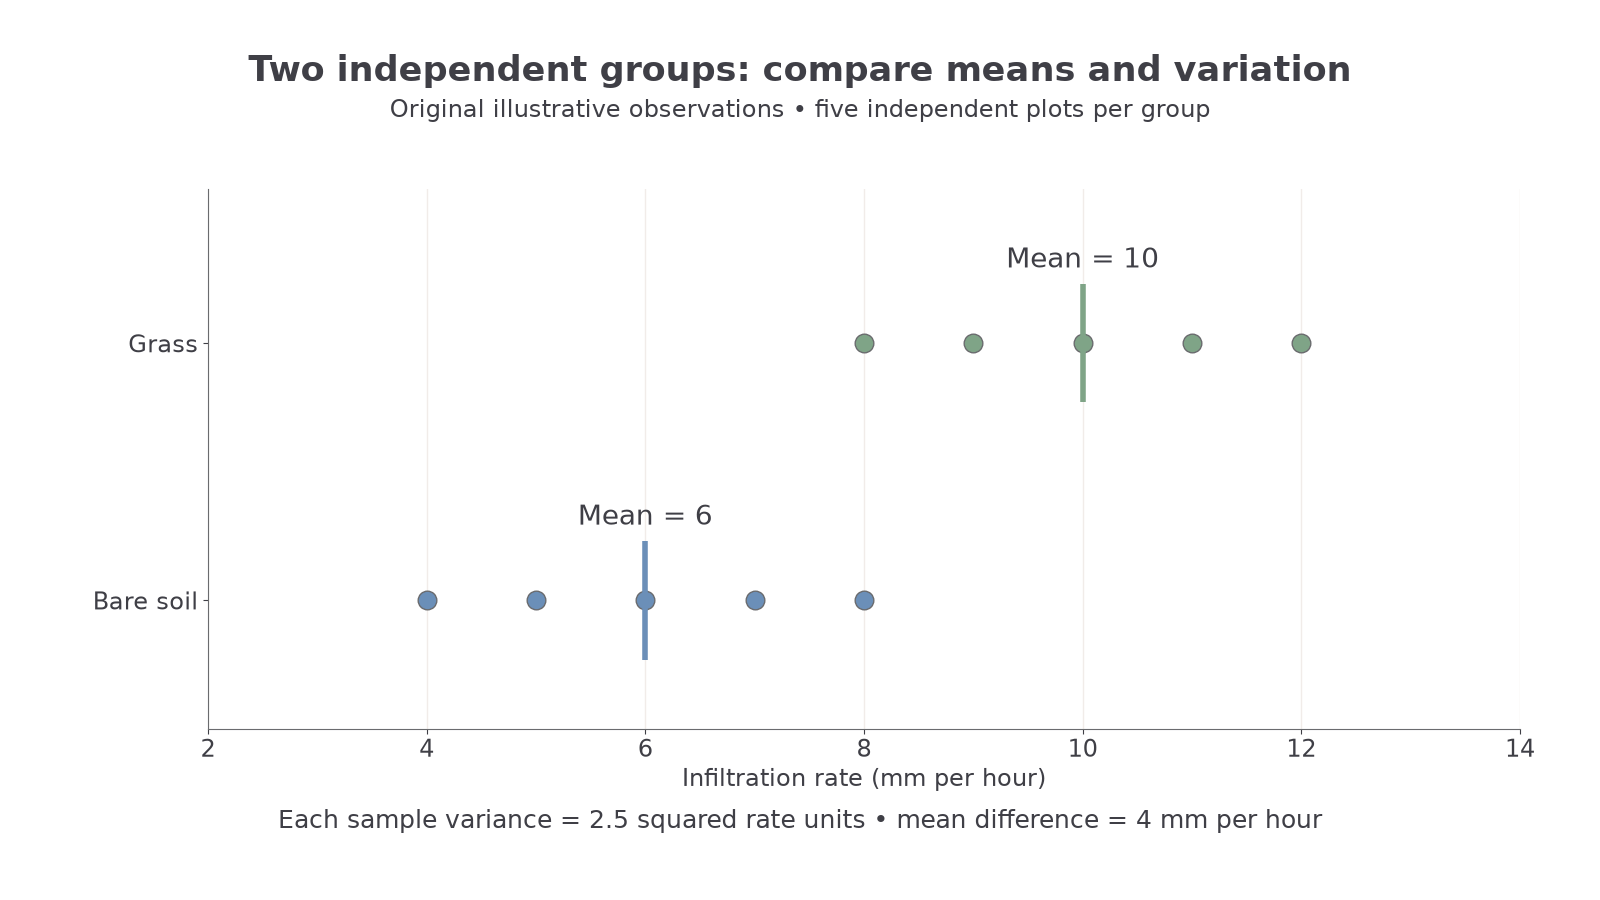
Original illustrative observations: grass mean 10 mm per hour, bare-soil mean 6 mm per hour; each group's sample variance is 2.5 squared rate units.
The standard error measures the estimated sampling uncertainty of a mean or mean difference, not the scatter of individual observations. It generally falls as the number of independent observations rises. Recording more readings from the same plot may improve that plot's measurement but does not necessarily reduce uncertainty about differences between populations in the same way as adding independent plots.
Applying an independent Student test
The pooled Student statistic compares the difference between independent sample means with its standard error under an equal-variance model.
Continue this lesson.
You’re previewing NovaLearn without an account. Create a free account to read the rest.
Create free account